


Market Pulse - 21st August 2023
Risk markets are having a price and sentiment momentum reset following the prolonged low vol environment. However, the broader patterns remain constructive for now.


Disclaimers
The content is for informational purposes. None of the content is meant to be investment advice. Use your own discretion and independent decision regarding investments. The opinions expressed in all RxR public research articles are the independent opinions of the authors at the time of publication and not the opinions of the affiliates of RxR.
Please see here for full disclaimers.
Stay informed about what really matters in crypto. Forget the noise. Get free market-leading crypto research by subscribing below:
Panic at the Disco
Last week was one for the books.
The cryptoasset market printed a drawdown of 8.3%, falling from its $1.13T mid-range zone to a low of $1.03T. This appeared to mark a stronger reversal of the YTD momentum investors were only just starting to digest.
Global market capitalization broke through with strength below the 200d MA - a key support level in bullish periods. This was before finding support at the $1T - the same level found in June after April’s peak. Only that time the $1T MCAP coincided with the 200d MA itself.
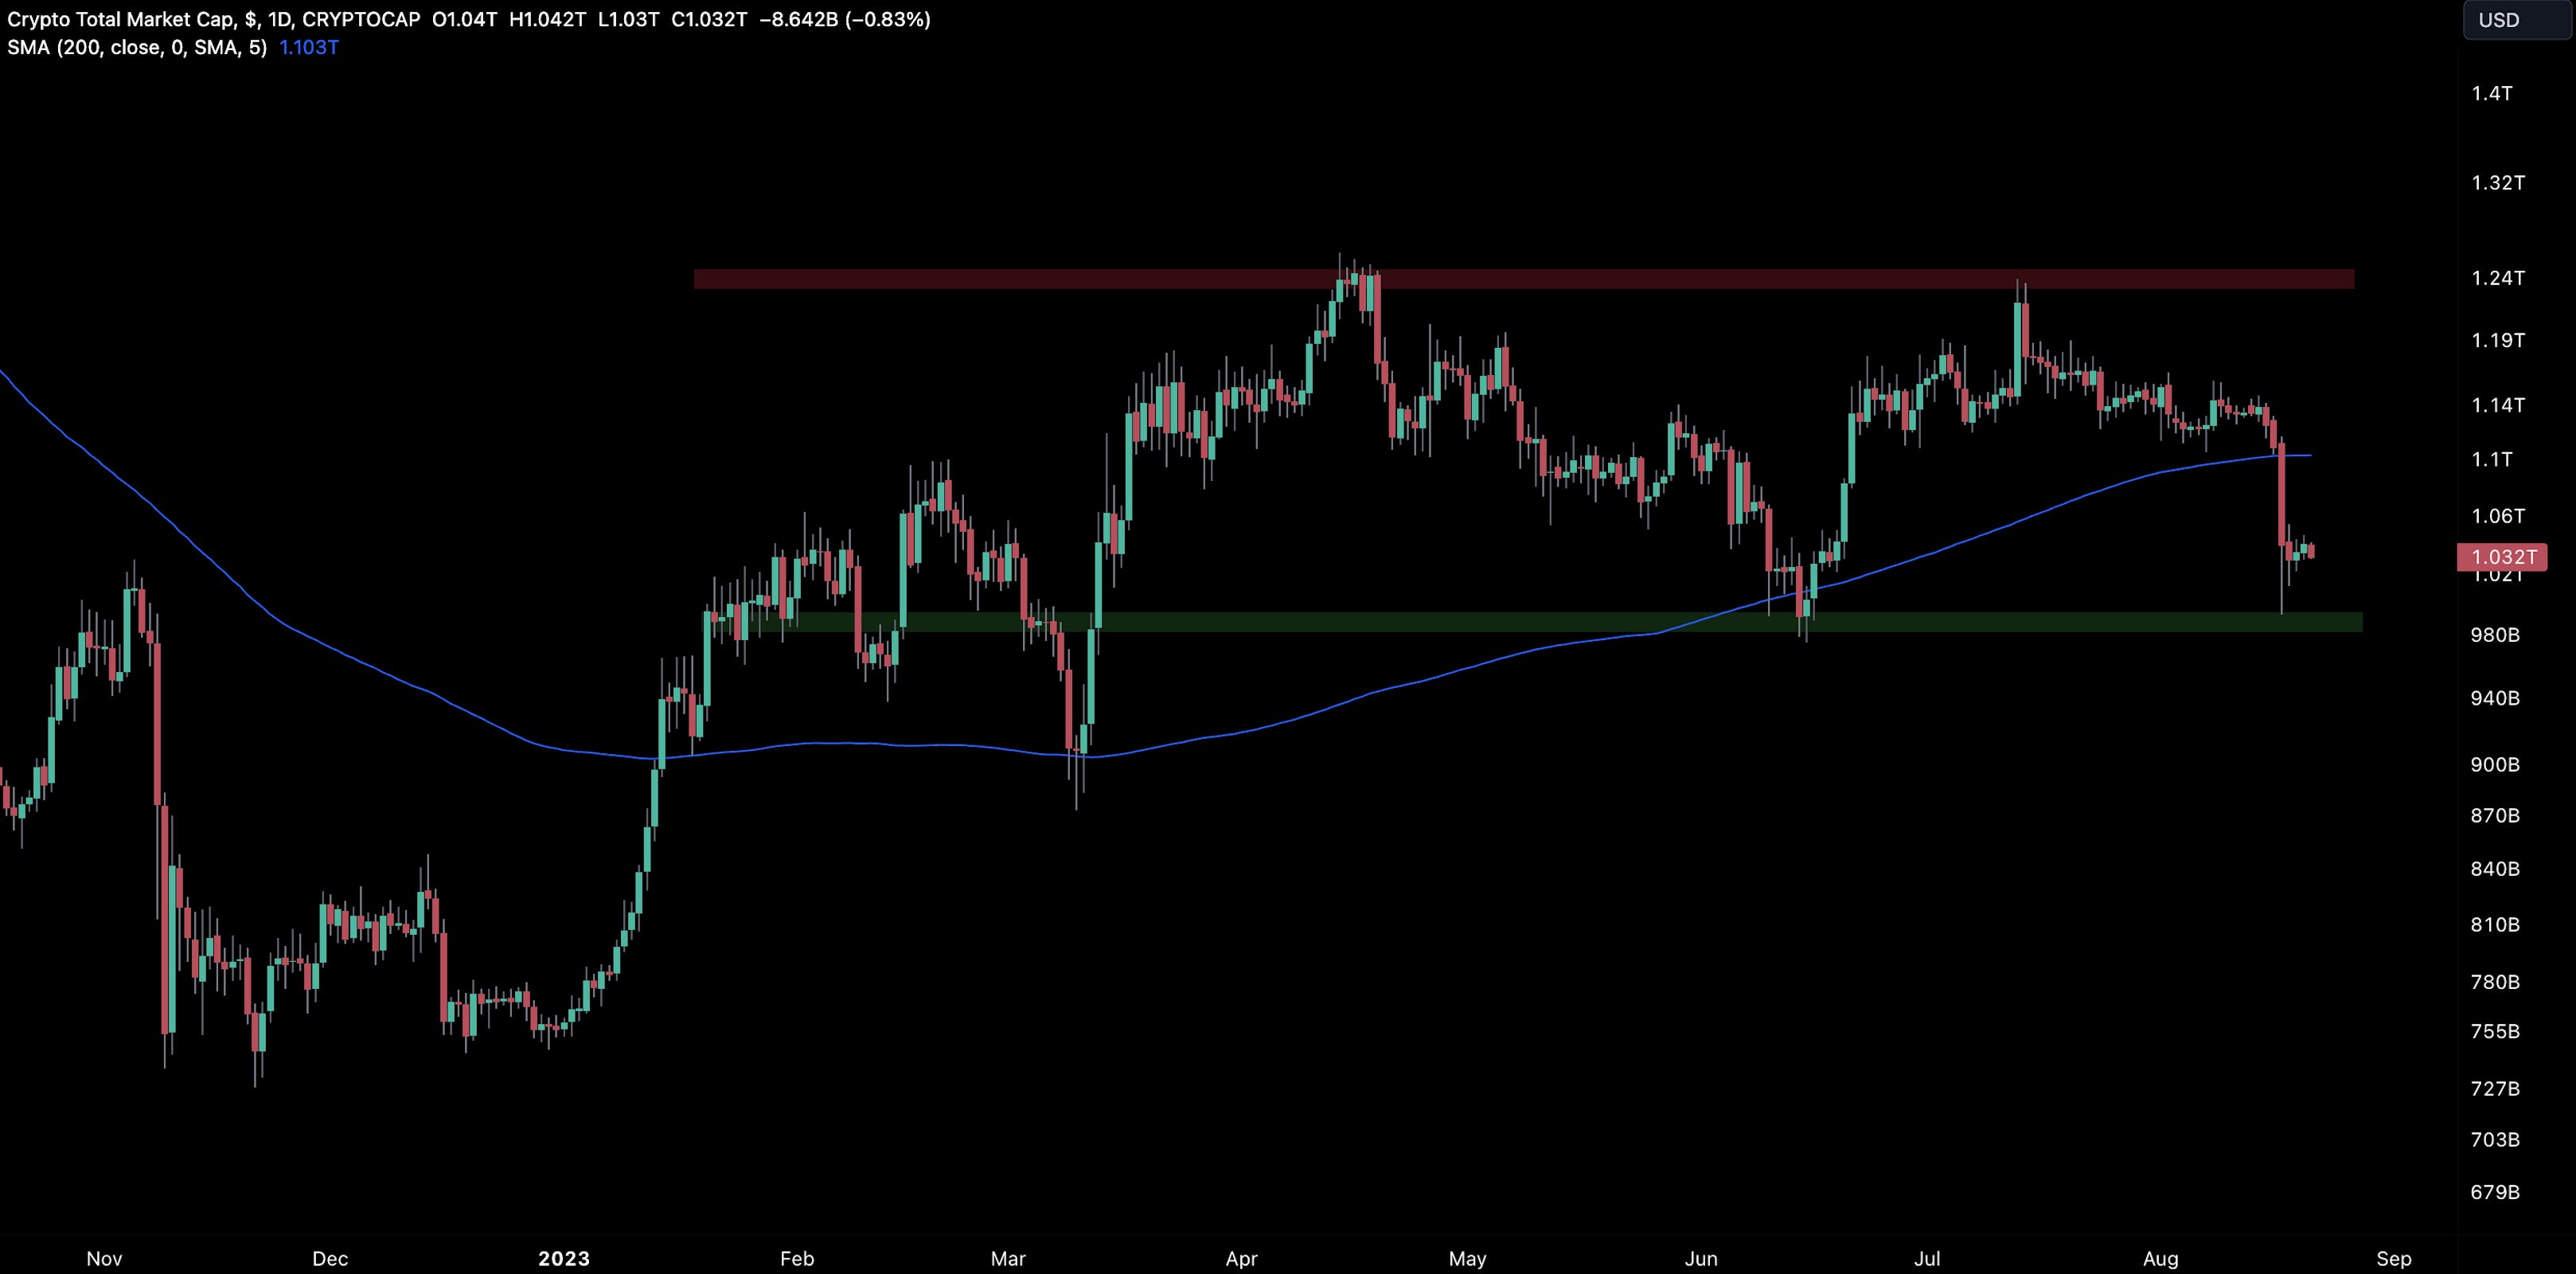
It was also notable in terms of magnitude. The weekly drawdown was the largest since the FTX crash…

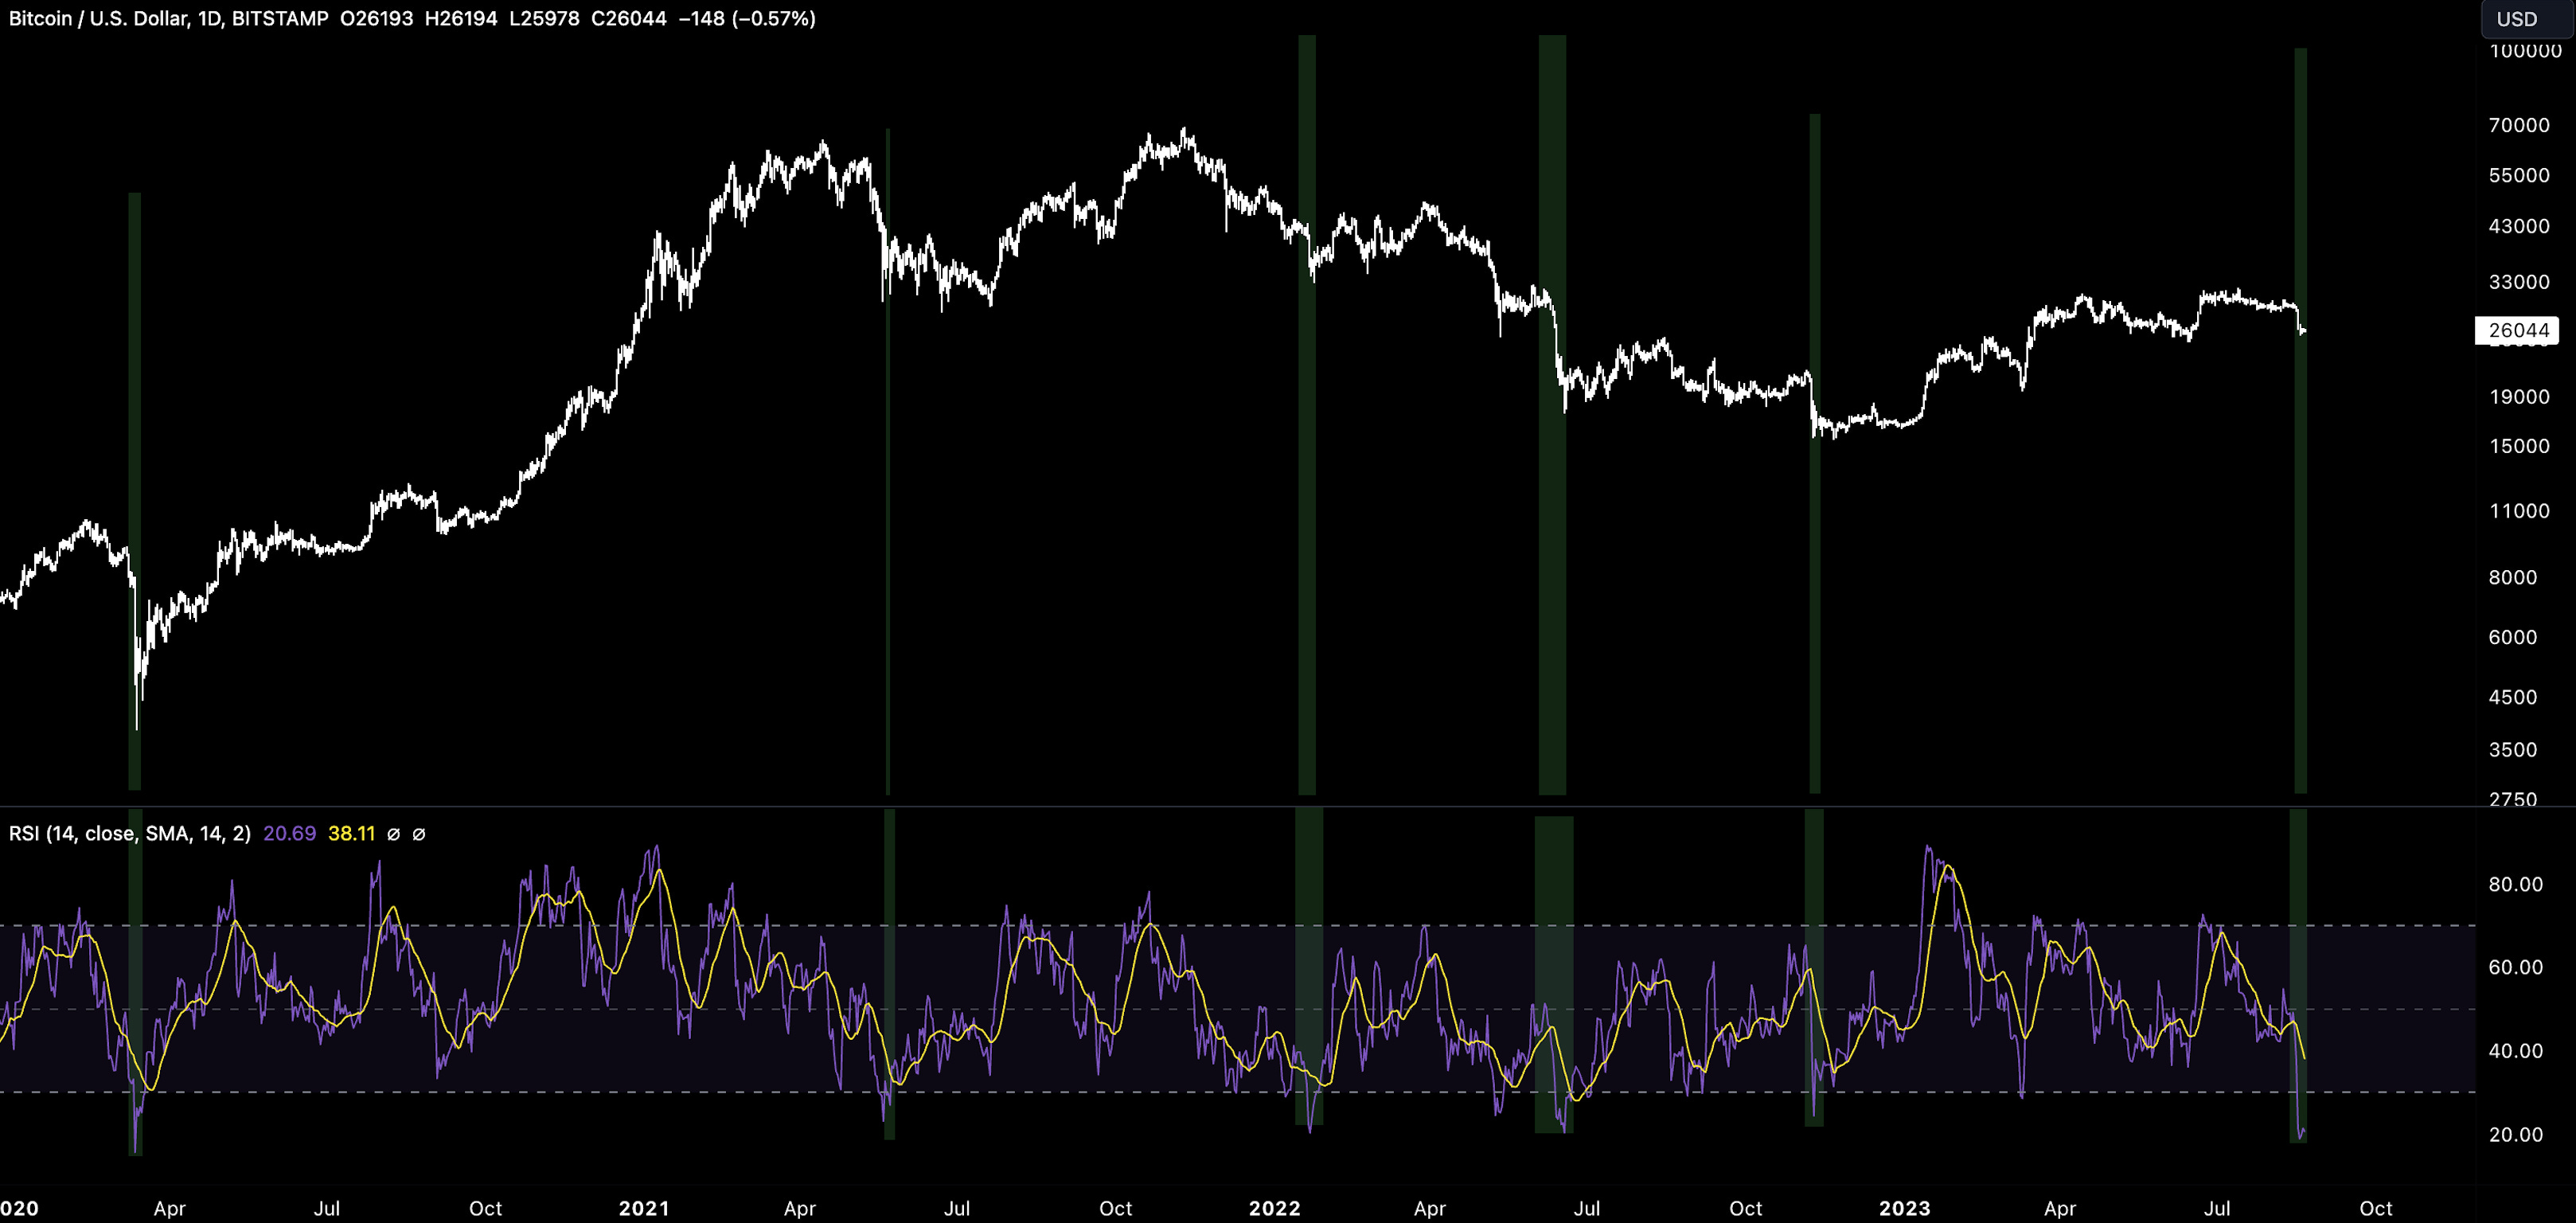
BTC’s daily RSI reached <20 - the most since March 2020 signalling severe oversold conditions. These have historically worked well in signalling a reversal in price. But the key is not the absolute values but divergences with RSI and price (e.g. April-July 2021).
Altcoin performance was dispersed with OP bucking the trend thanks to the launch of Base protocol (built on the OPstack). Investors still care about underlying fundamentals and relative performance shows this time and time again.
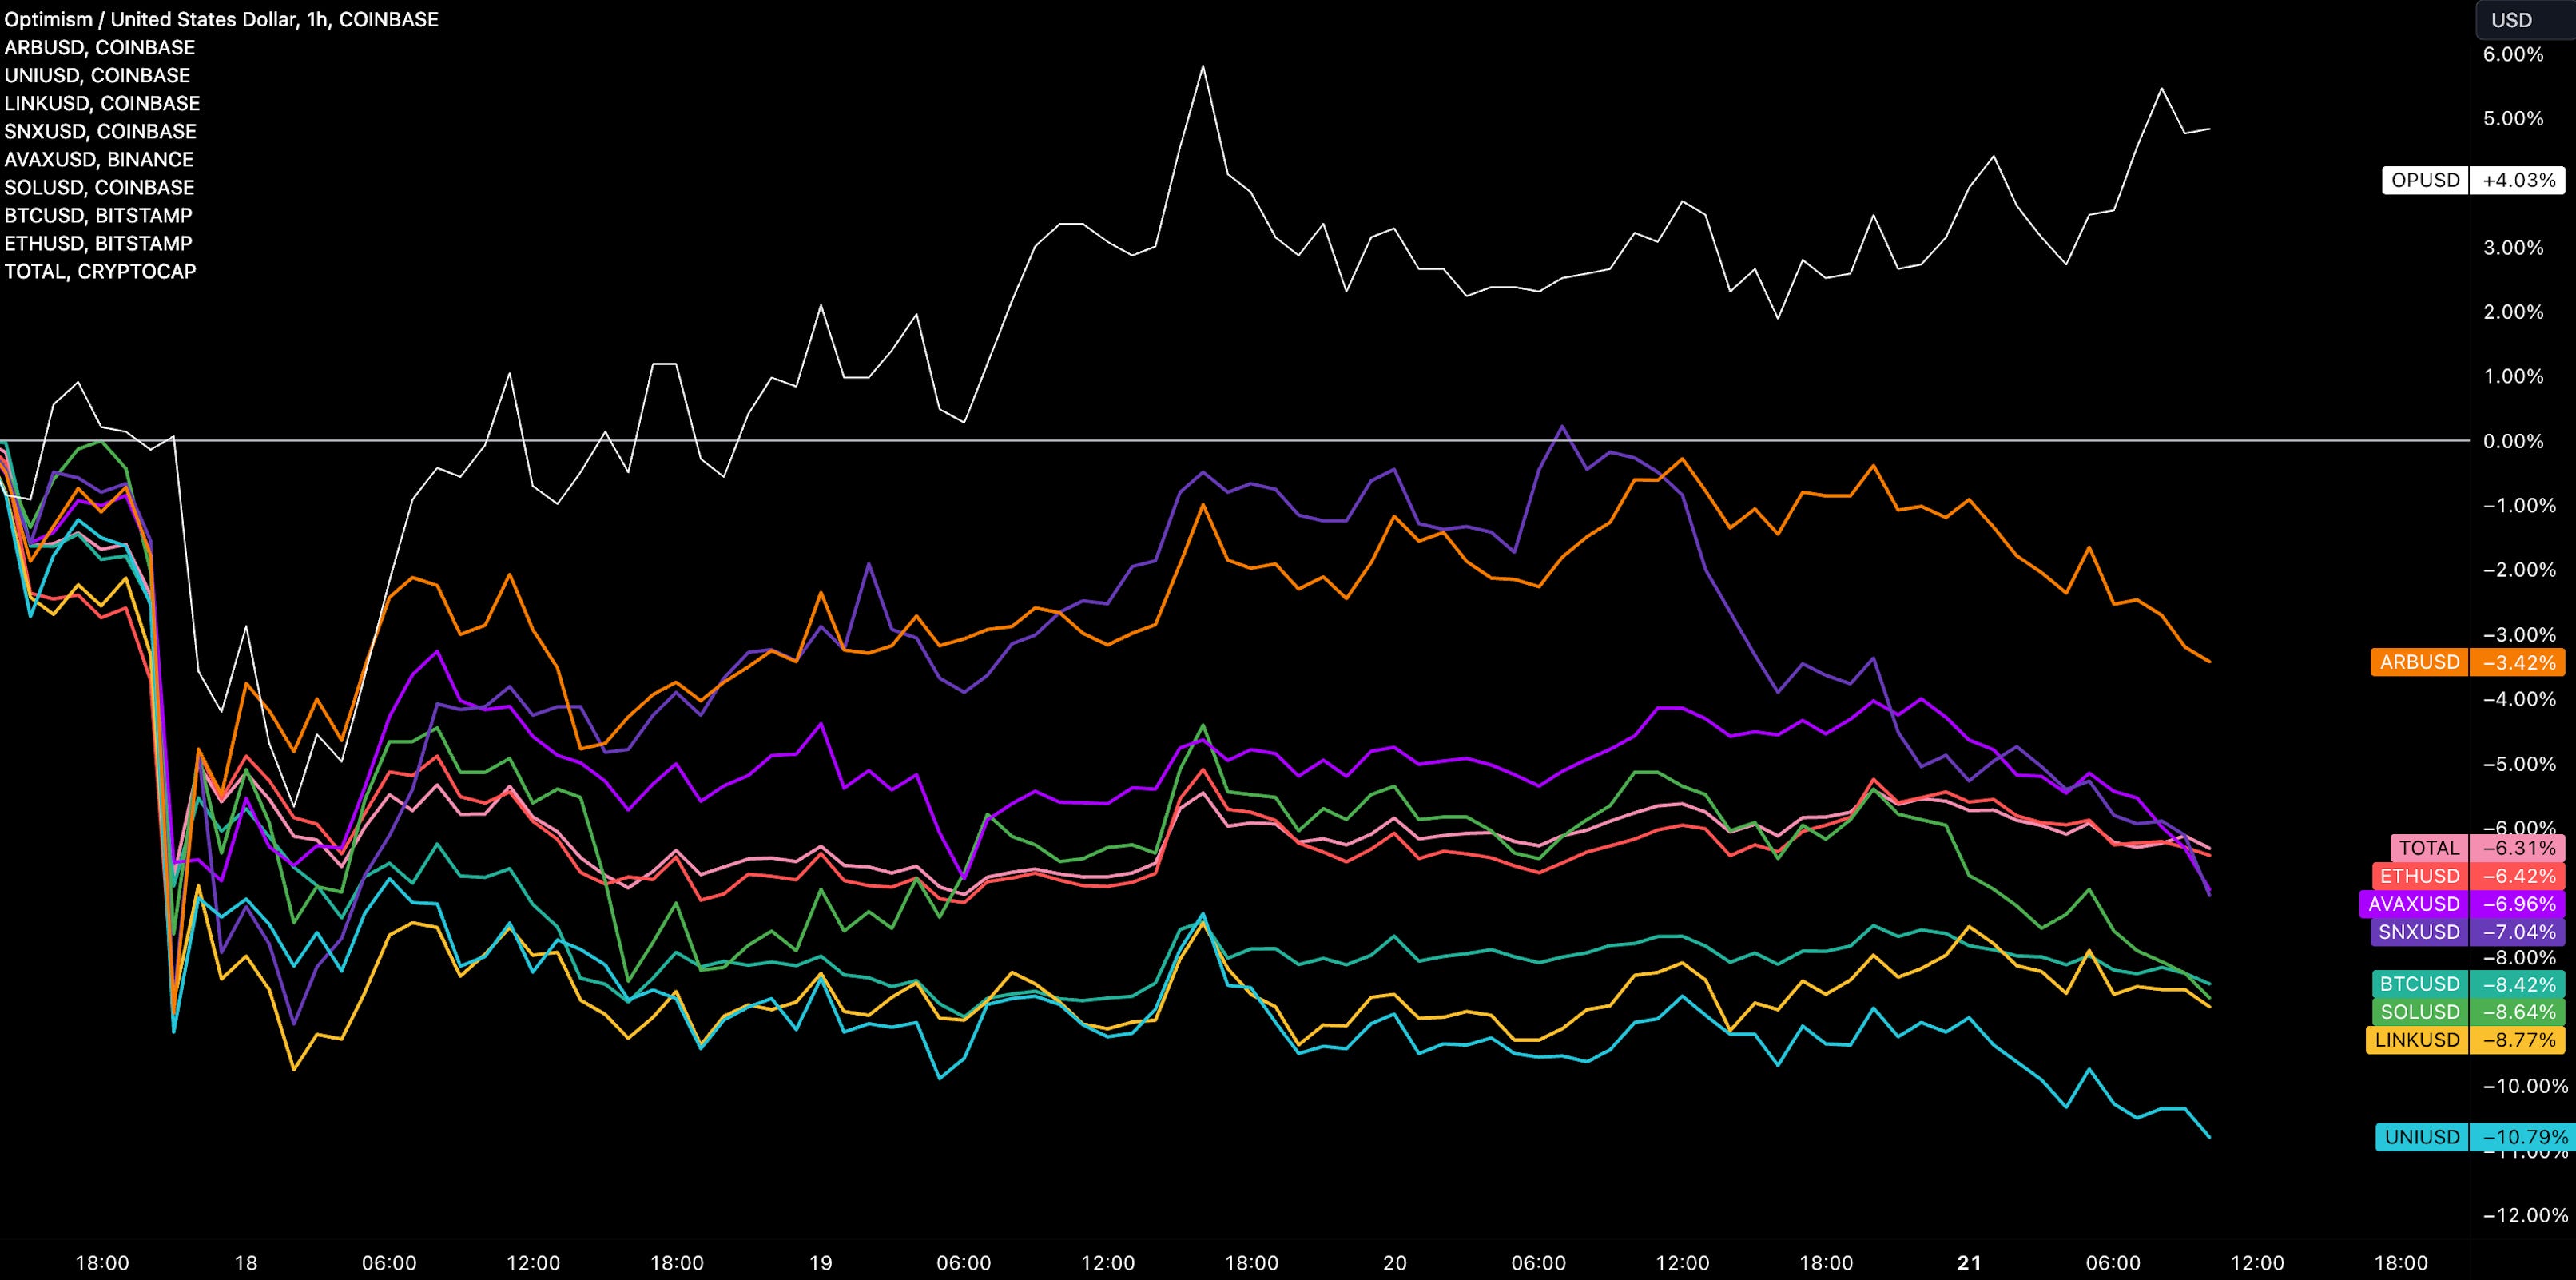
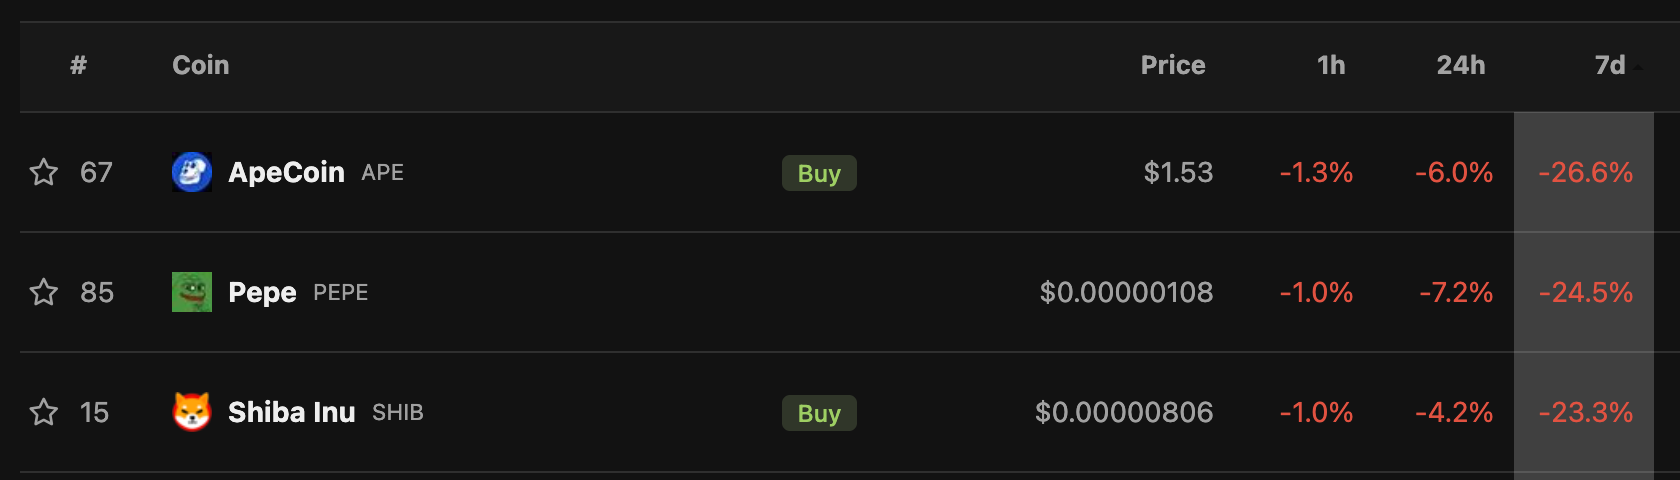
The top 3 worst performing assets were all ones far down the risk continuum - NFTs and meme coins. From this perspective, the moves last week also showed characteristics of a classic risk-off period of capital rotation from the most speculative assets.
So what happened? The first thing to note is the set-up leading into last week.
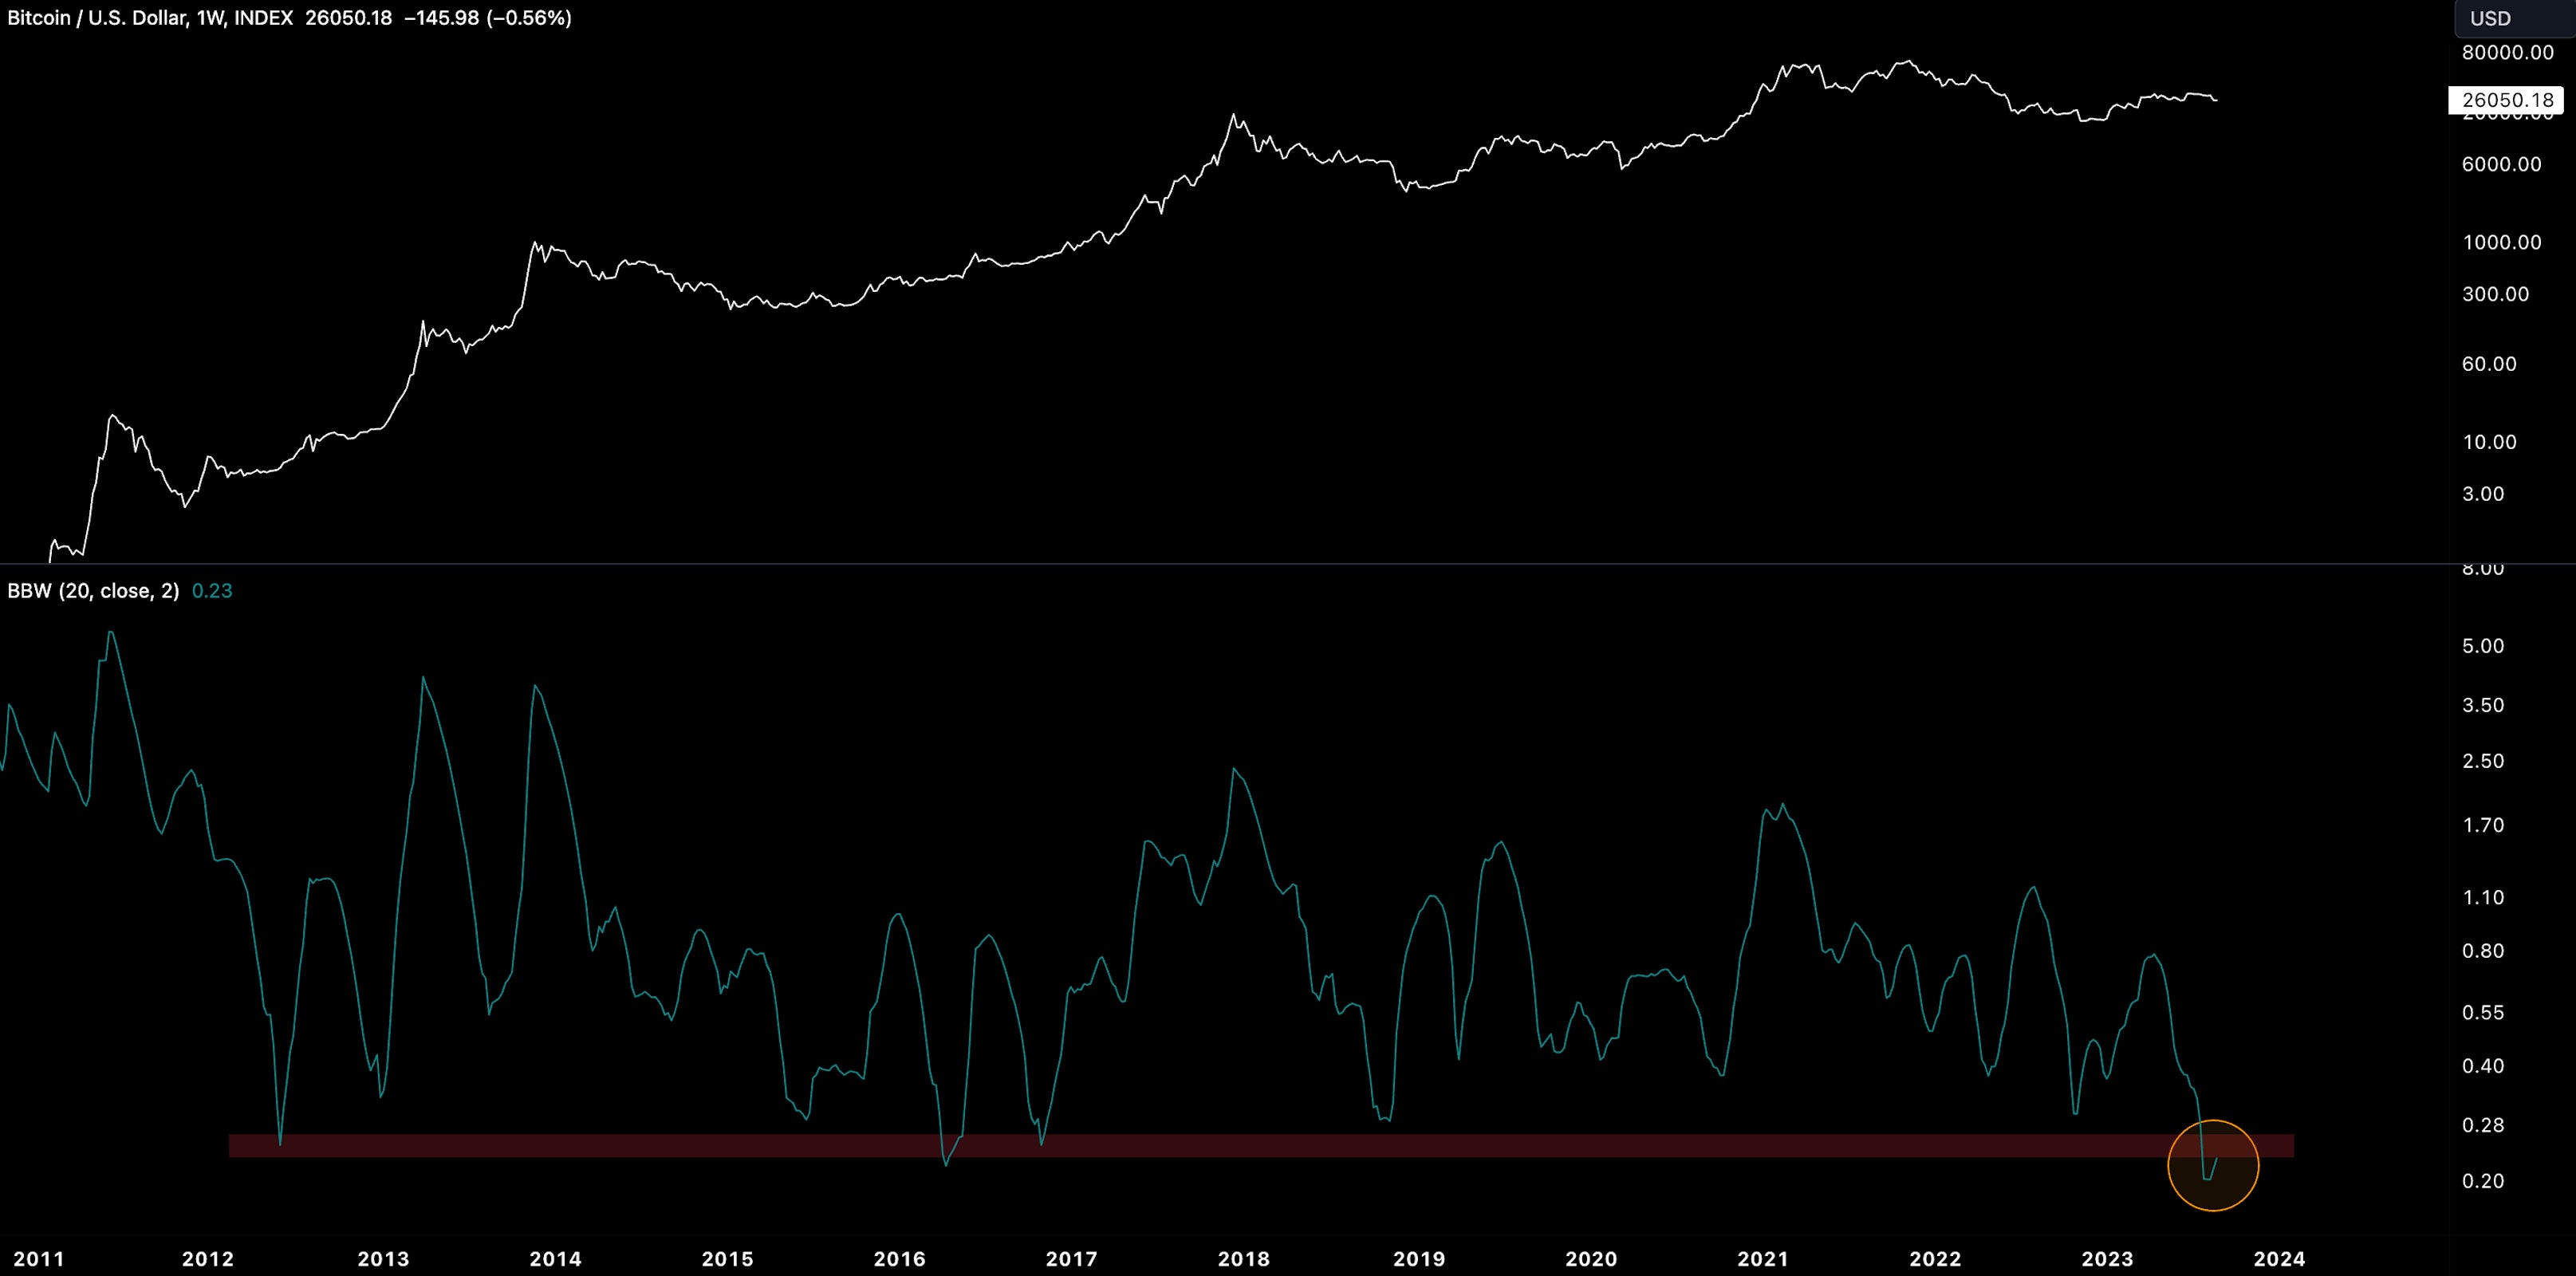
The weekly realised vol for BTC hit all-time-lows suggesting a more violent move was forming.
Spot volume trends YTD also pointed to investor inertia, falling to a near YTD of $11.2B with volumes never being able to regain the March highs of $47B daily.

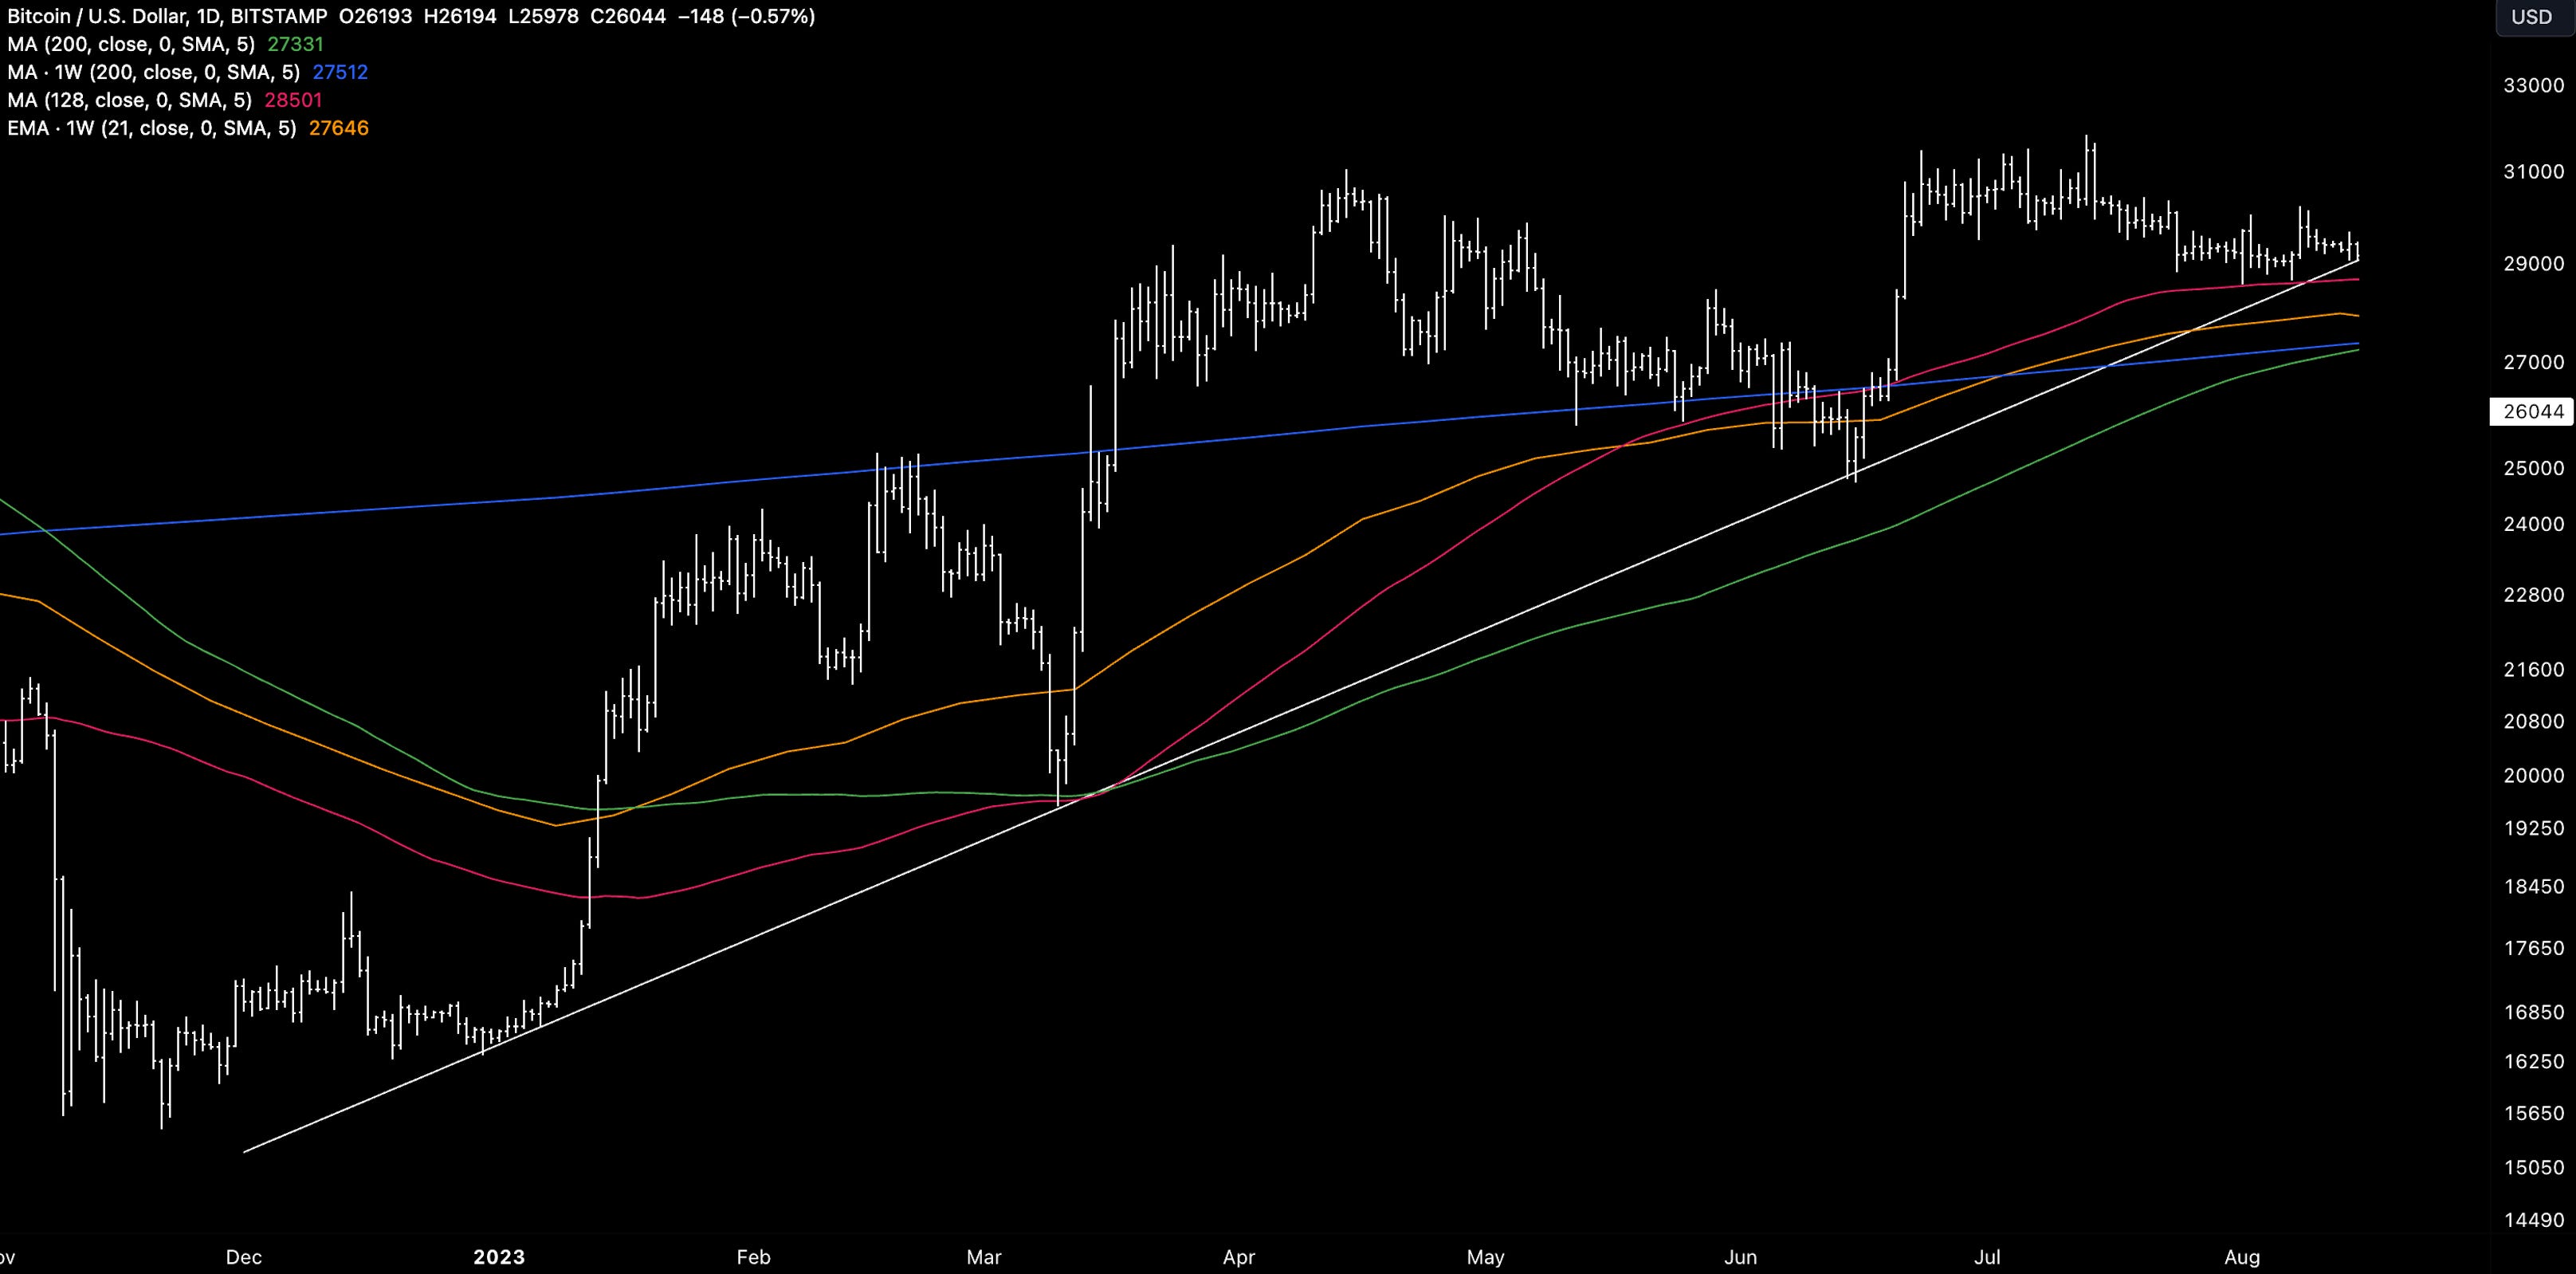
And investors were starting to feel constructive. Firstly, the technicals pointed to an opportunistic period for the bulls with BTC reaching its YTD support trendline above a confluence of MAs (200d, 200w, 21d EMA, 128d MA).
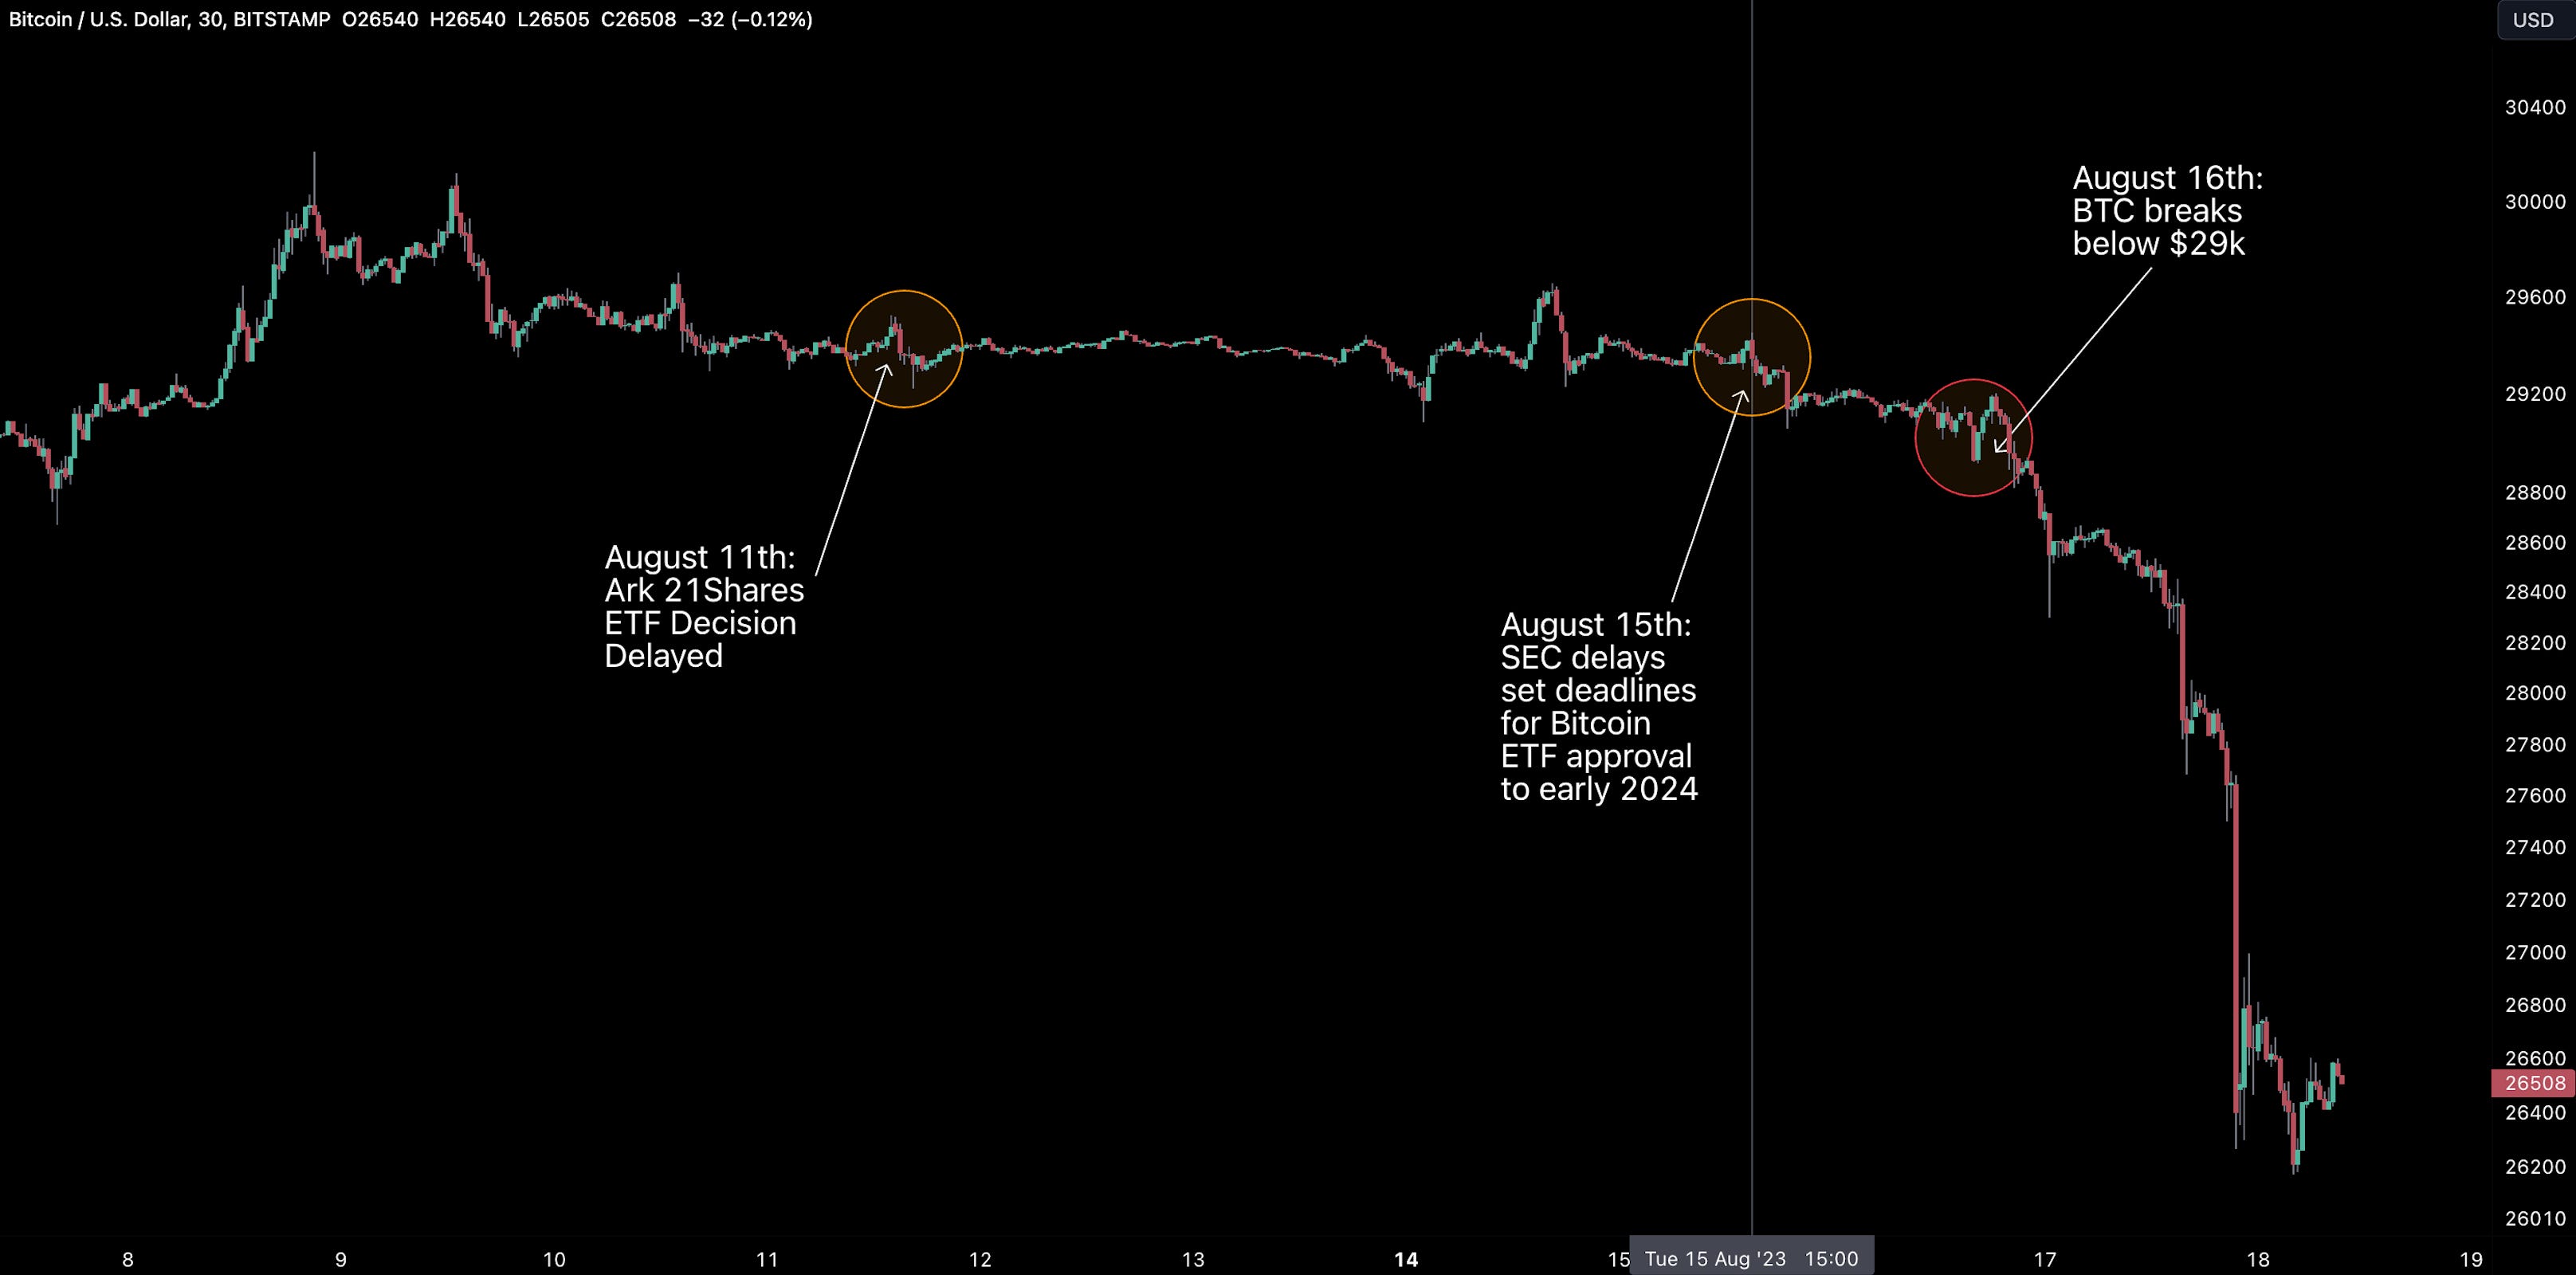
$29k was the key level here - we’ll come back to this point later.
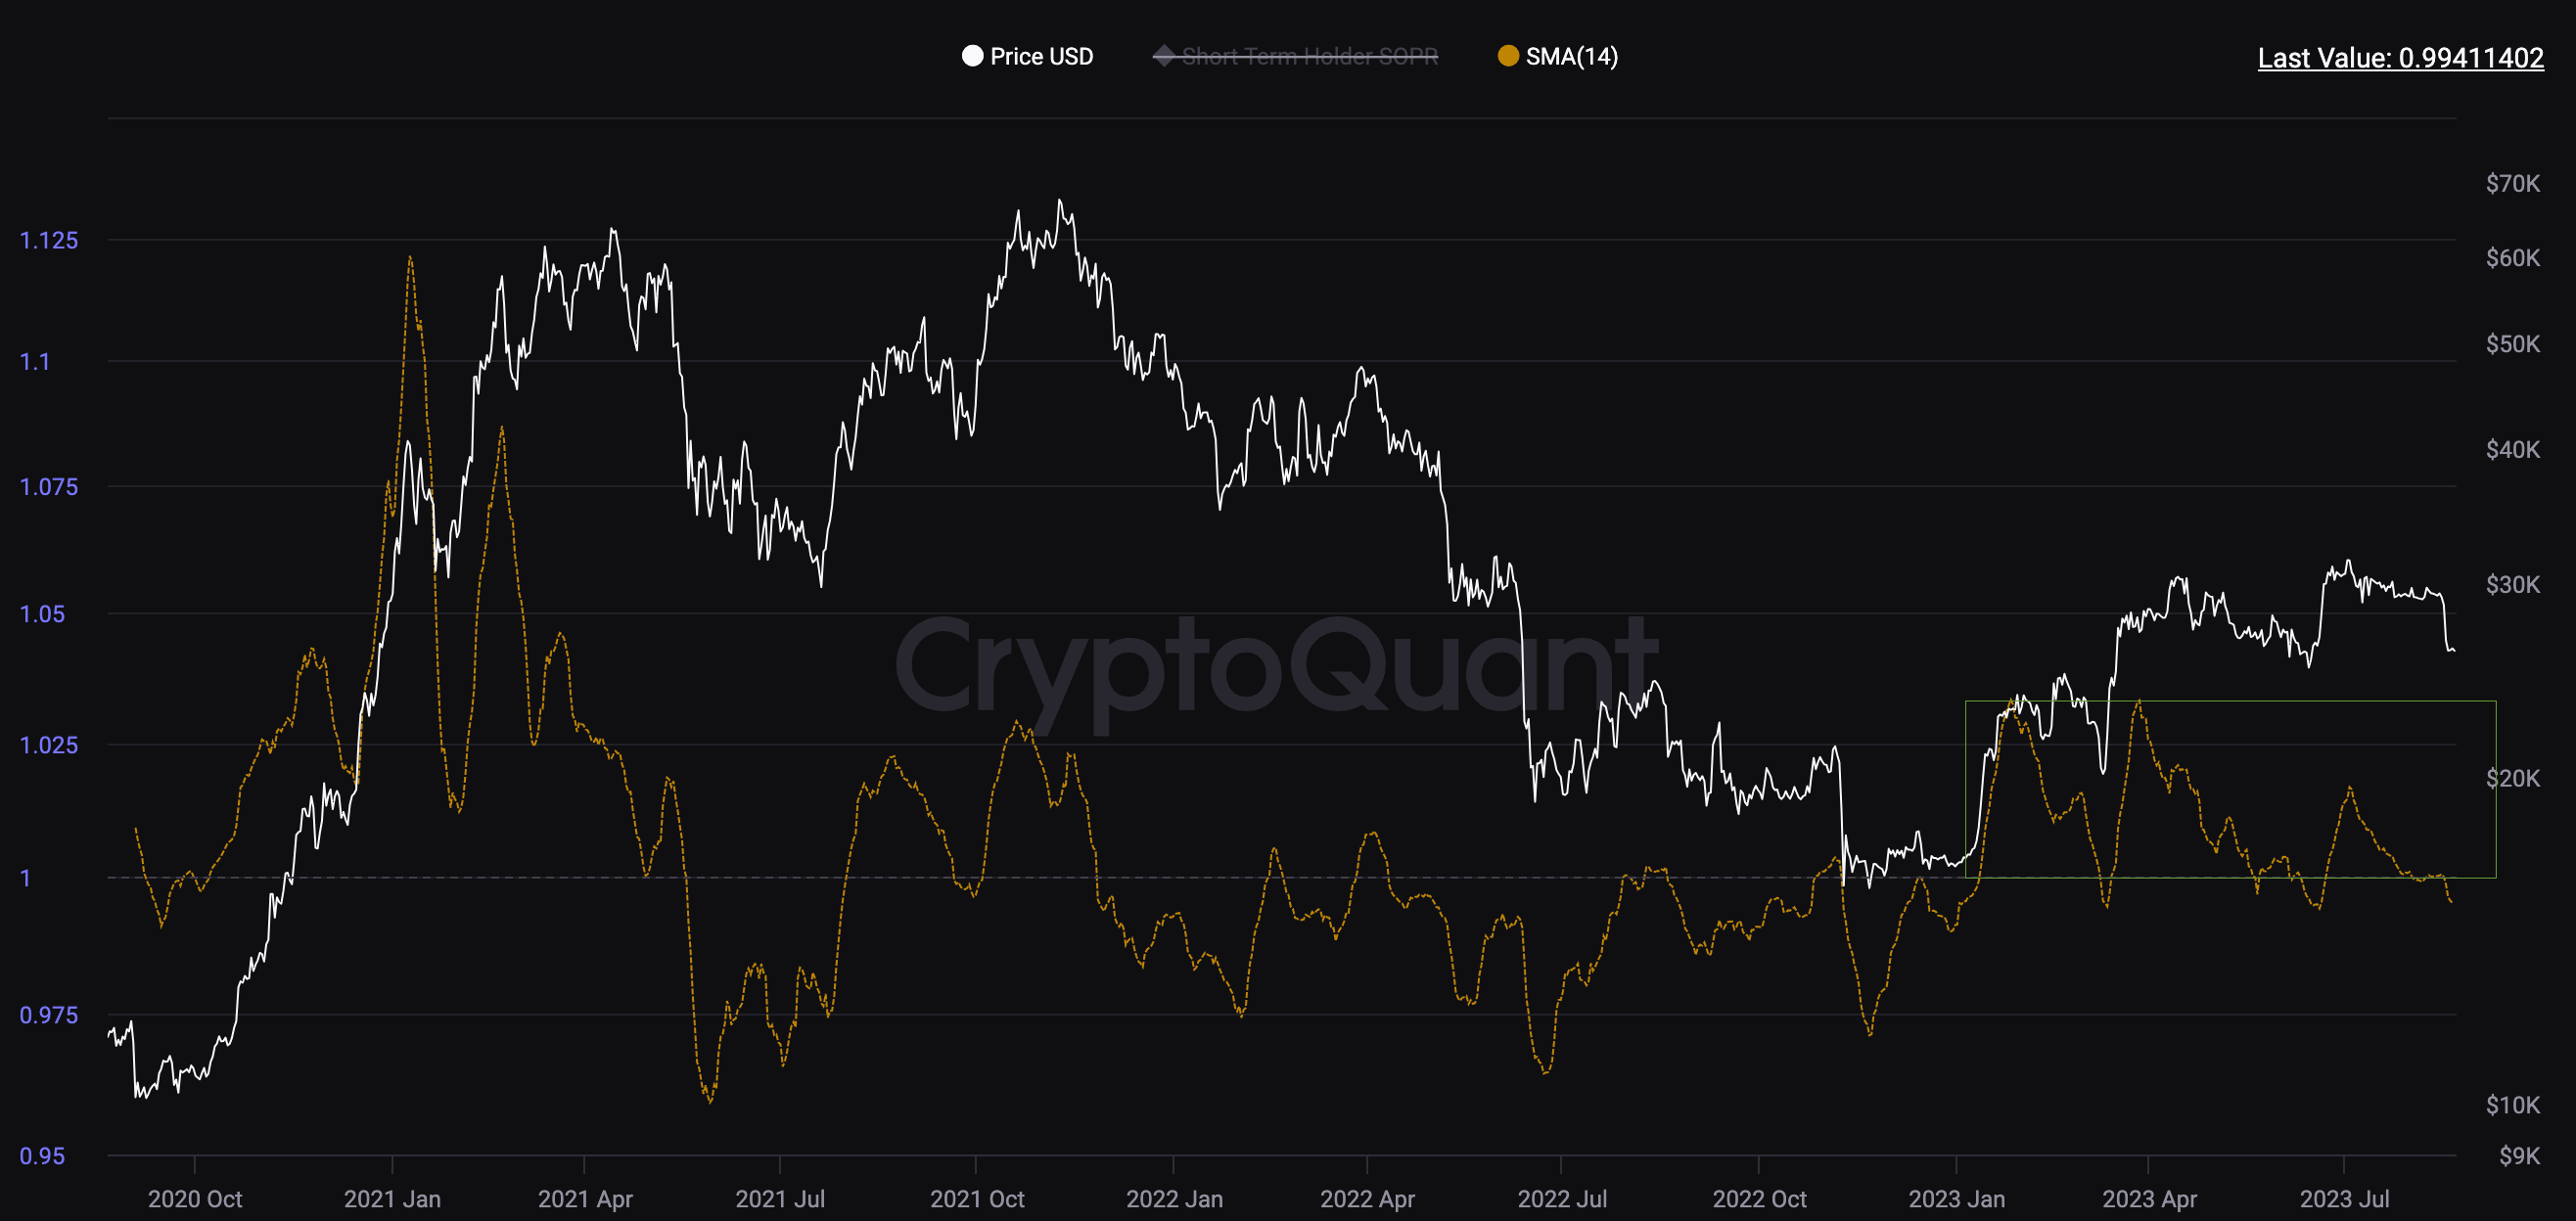
On-chain metrics that act as a proxy measure for investor spending behaviour also pointed to a constructive outlook. For example, Bitcoin’s STH-SOPR found support just below 1 but remained above 1 YTD. Short-term holders were not realising severe losses.
The measure often stays above 1 using 1 as support in bullish periods and vice versa for more prolonged bearish periods.
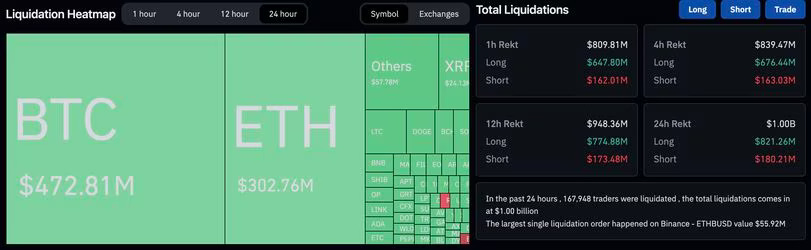
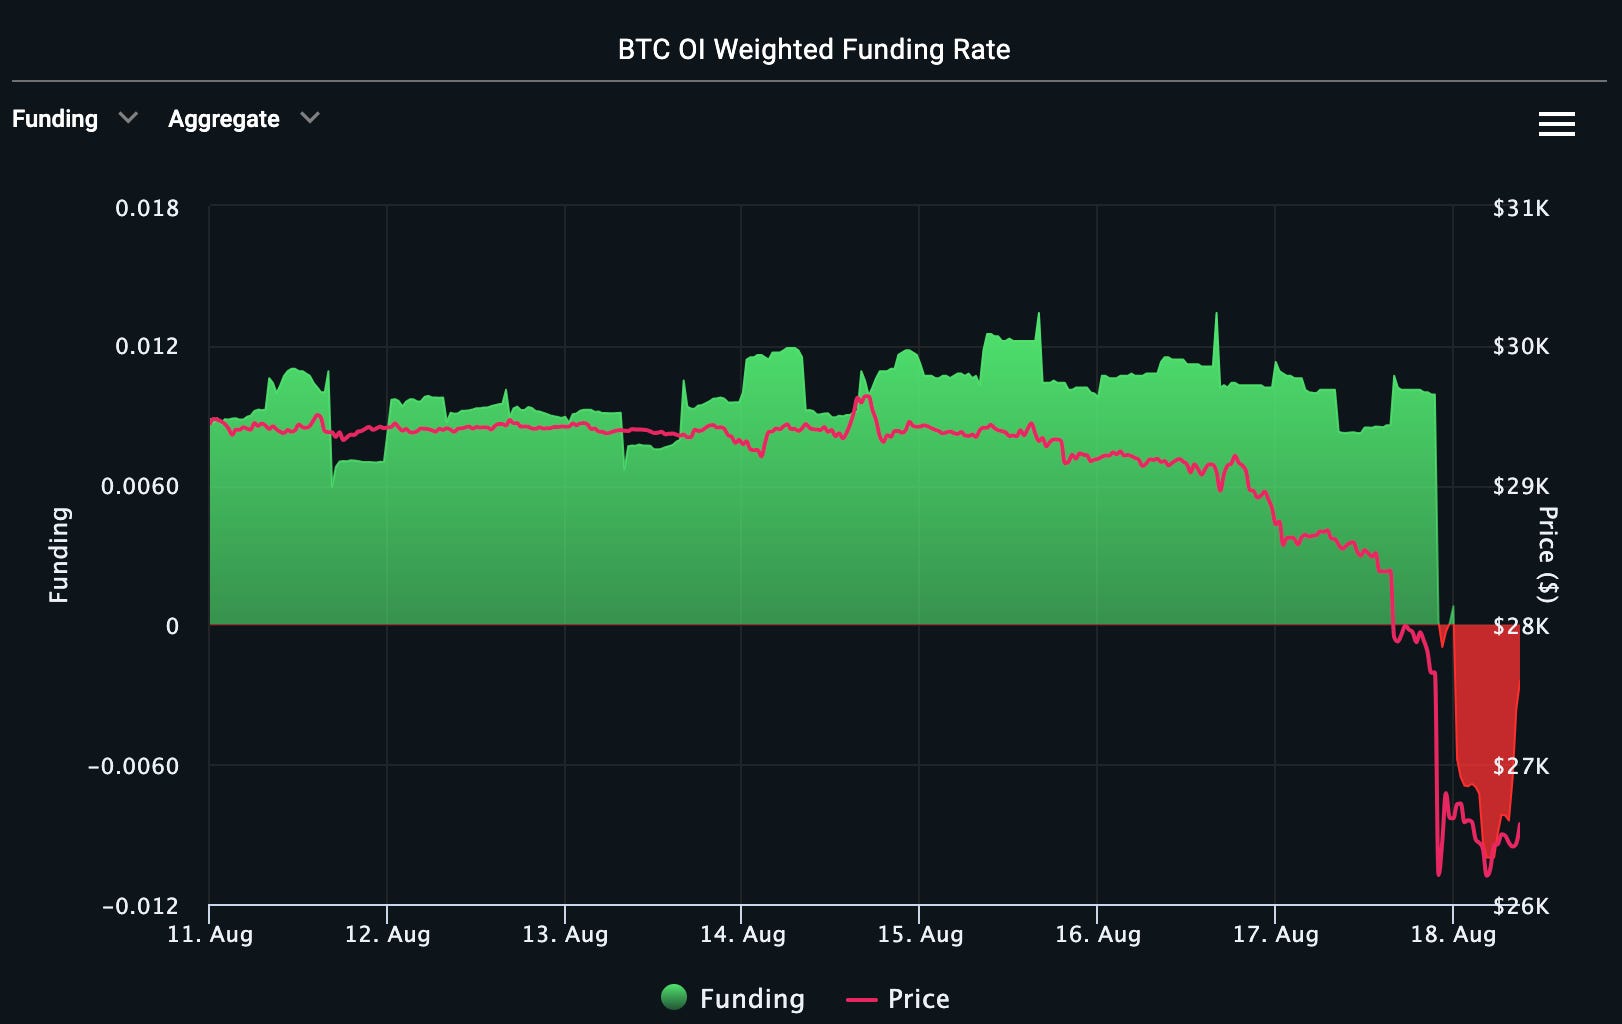
The drawdowns were exacerbated by futures liquidations with global volume reaching $1B in 24hrs by Friday morning. The majority of these volumes were BTC-centric ($472m) with the asset having its largest single day of liquidations since June 2022.
Funding rates remained positive (0.01-0.012) over the past week despite BTC pull towards $29k. Traders kept being bullish until $28k was broken.
It was this level that confirmed a break of the YTD support that all the bulls had their eye on.
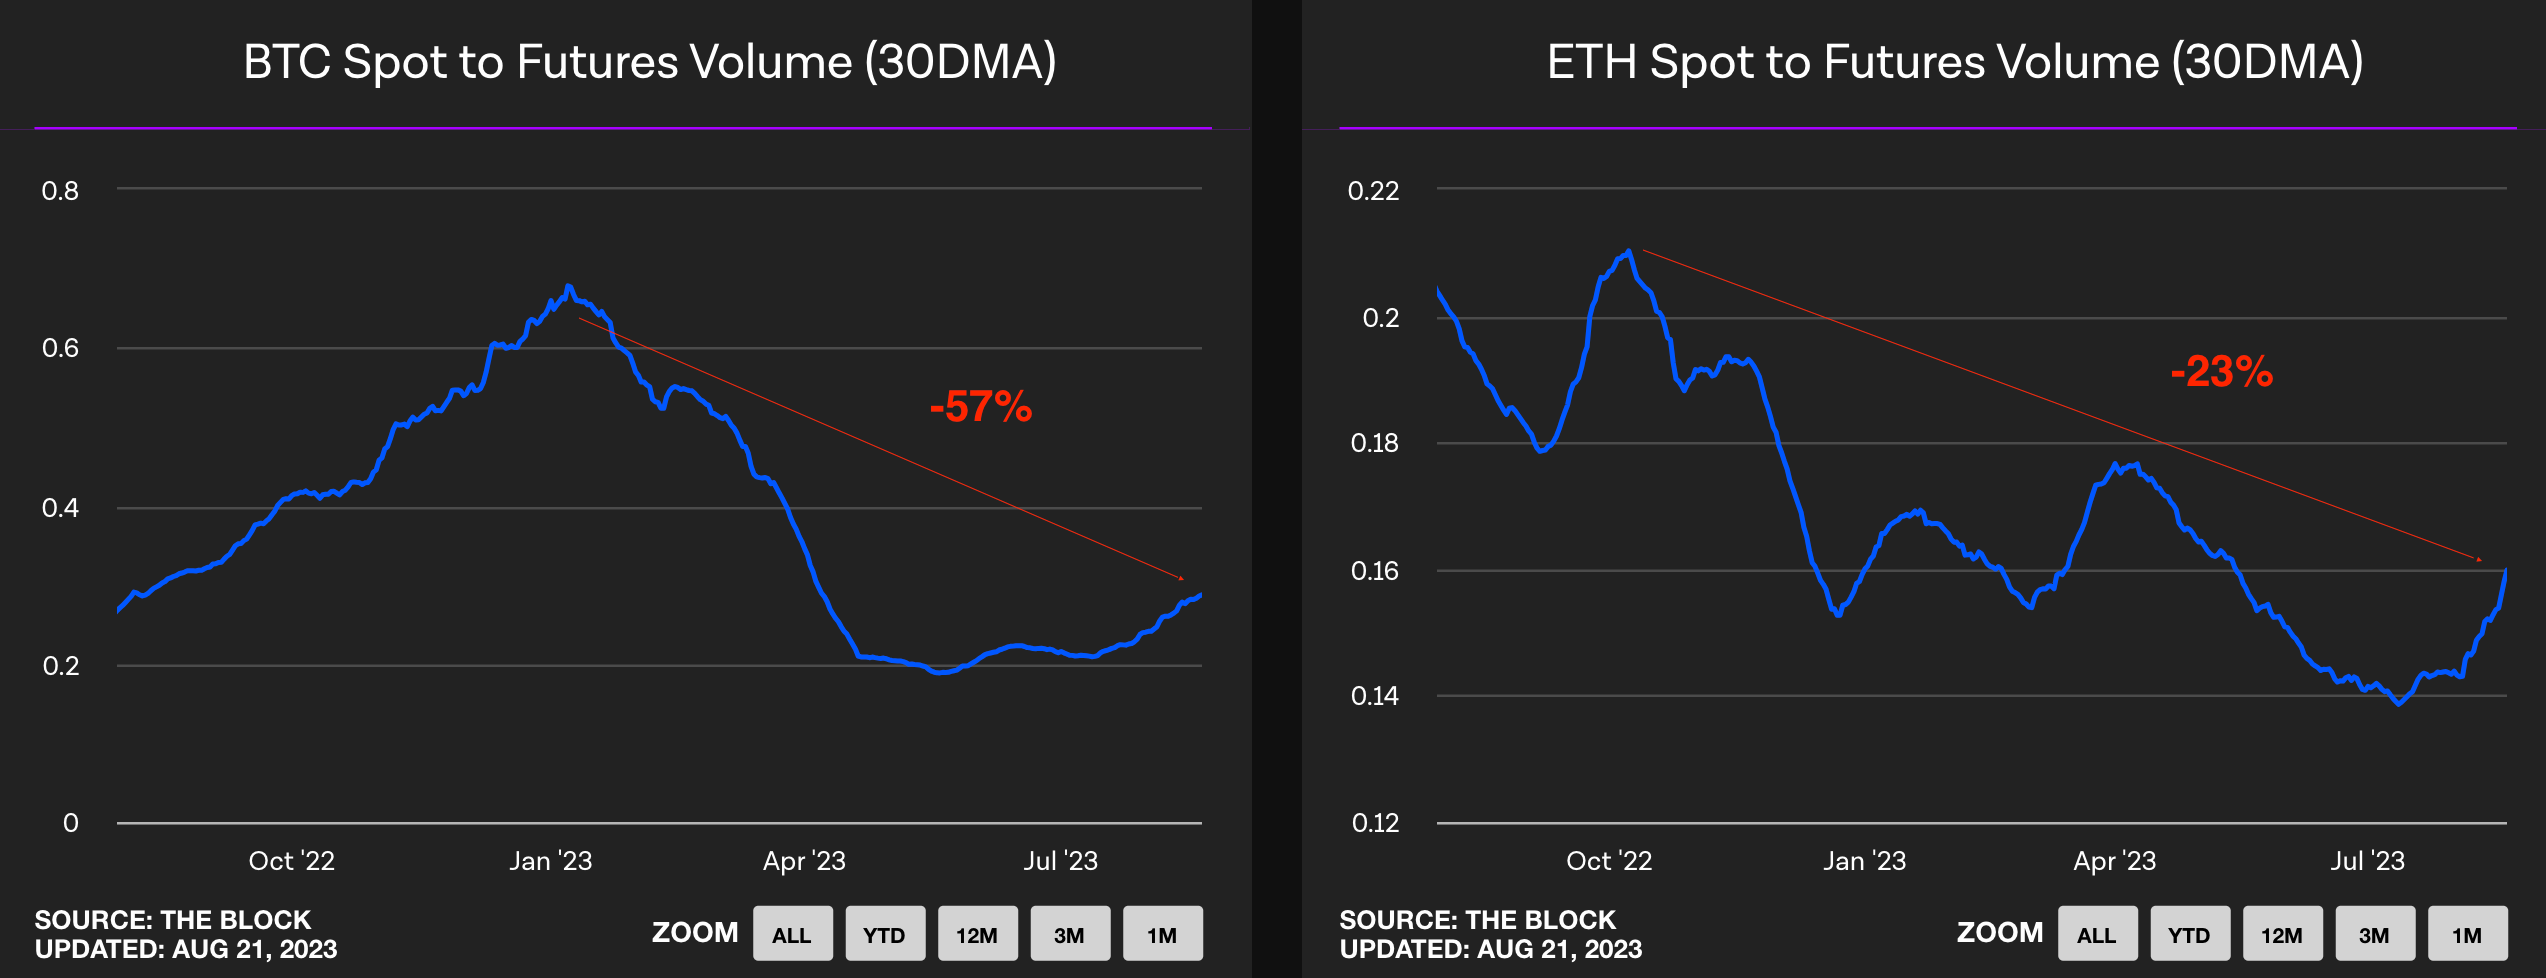
The futures markets are dictating price action more than spot. Spot/futures volume ratios for a number of key assets have been declining over the past 8-9 months with BTC markets seeing a larger decline than ETH markets.
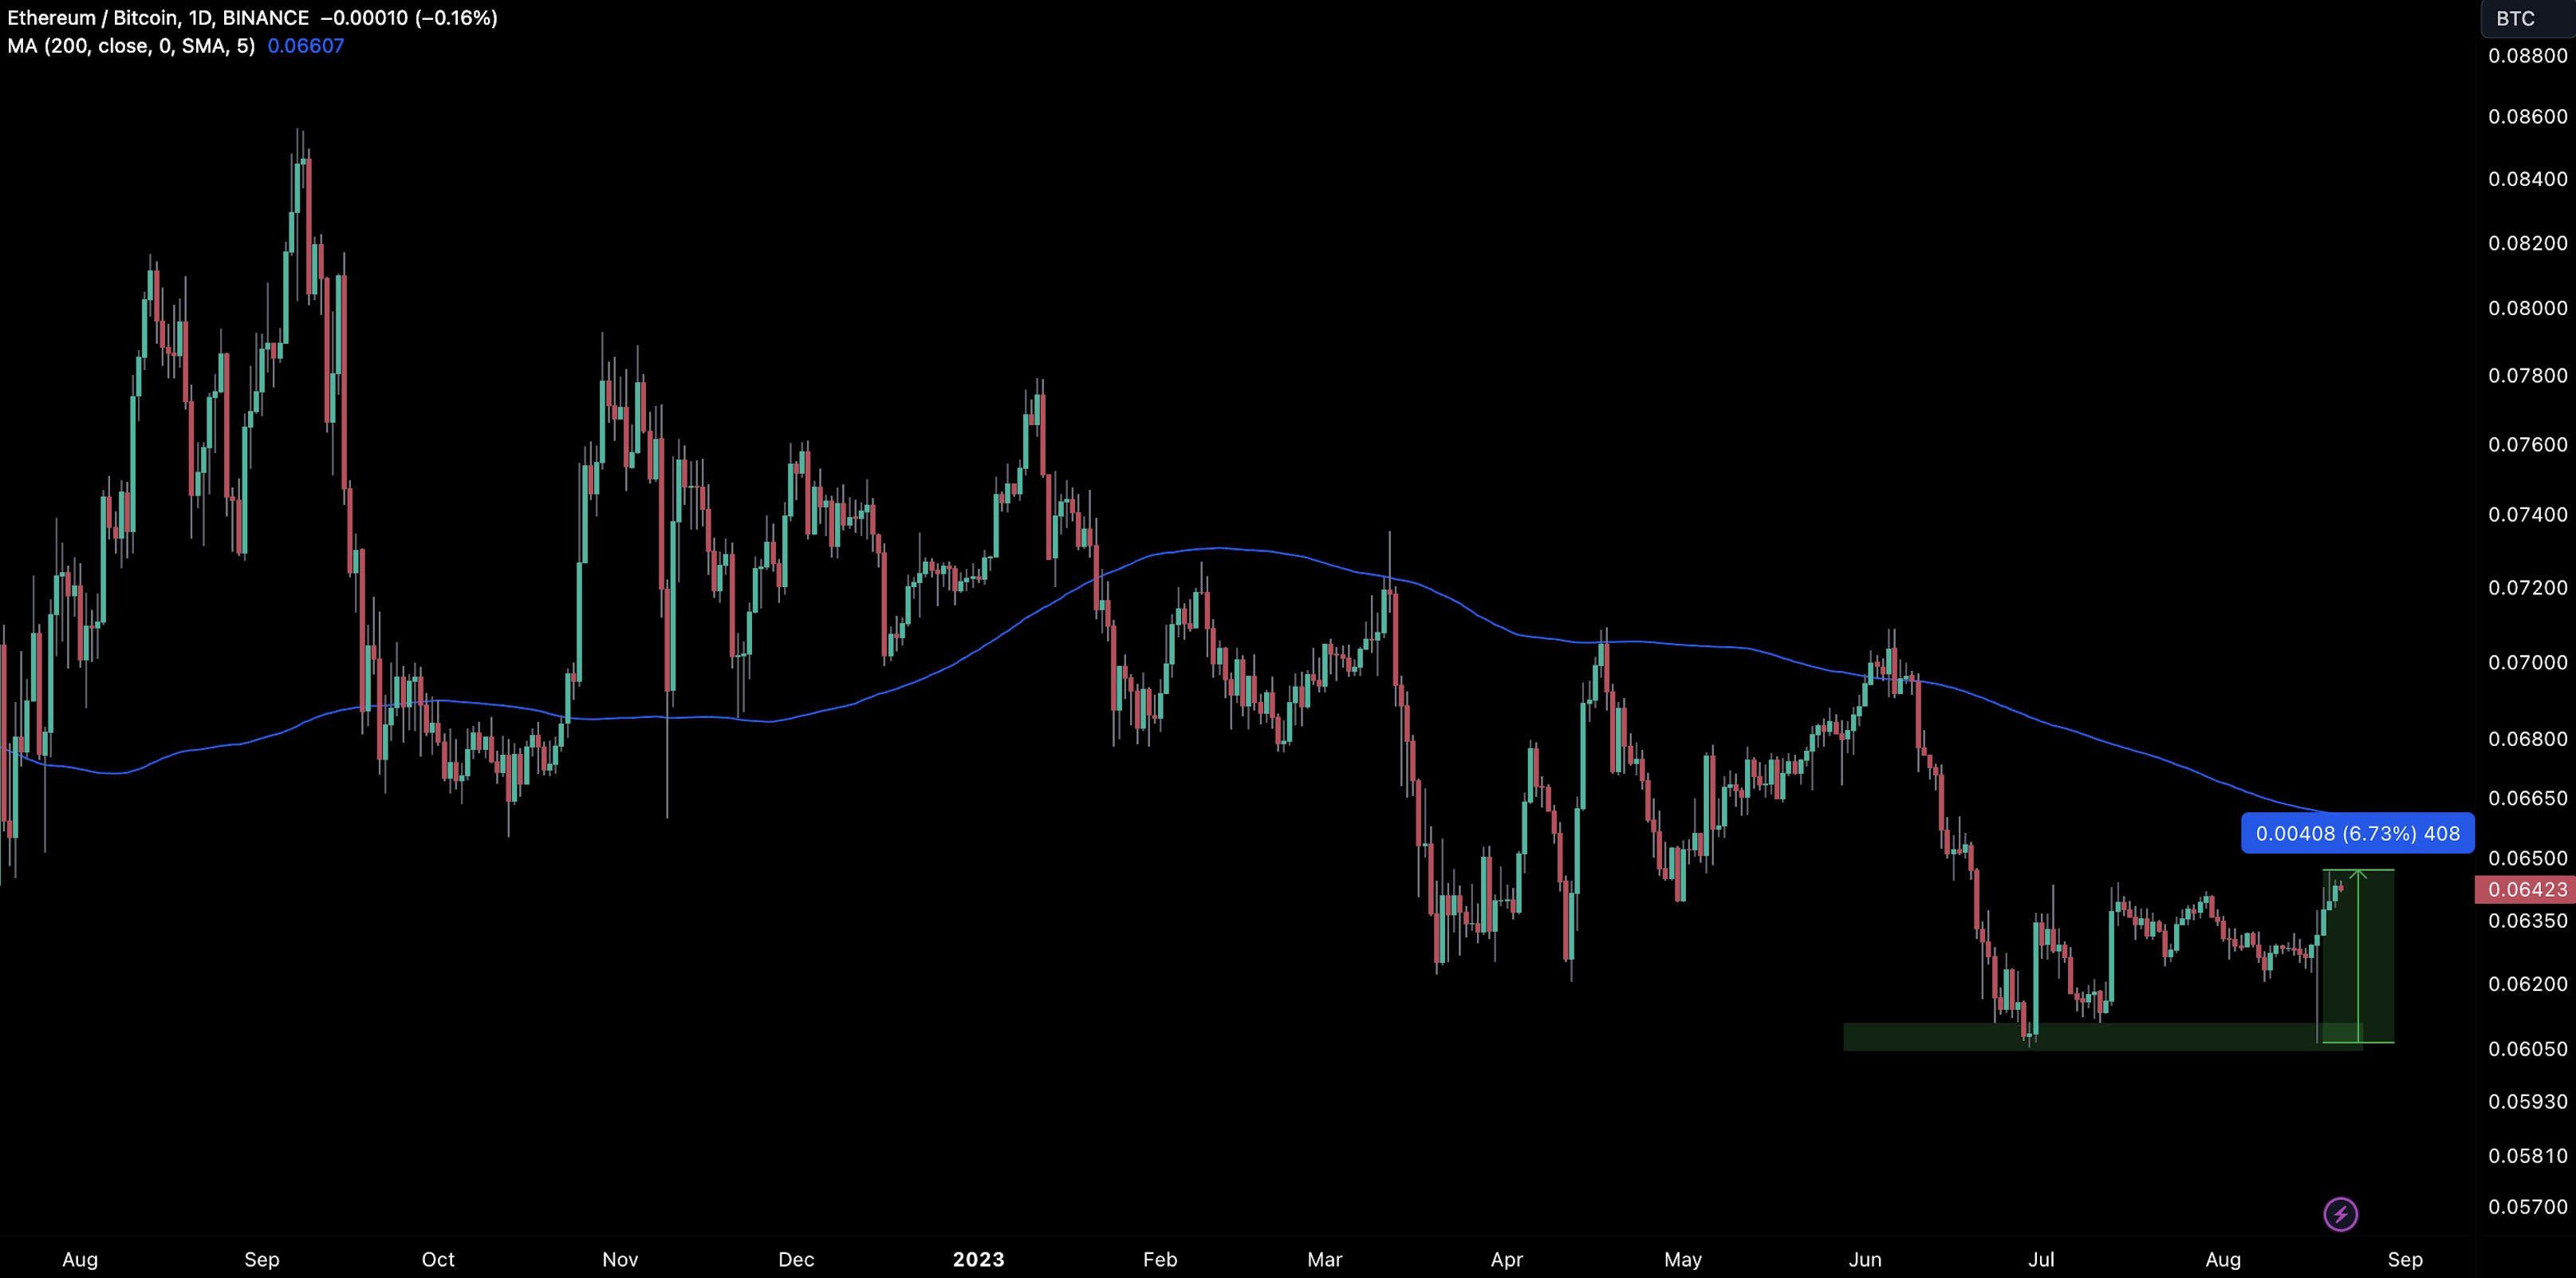
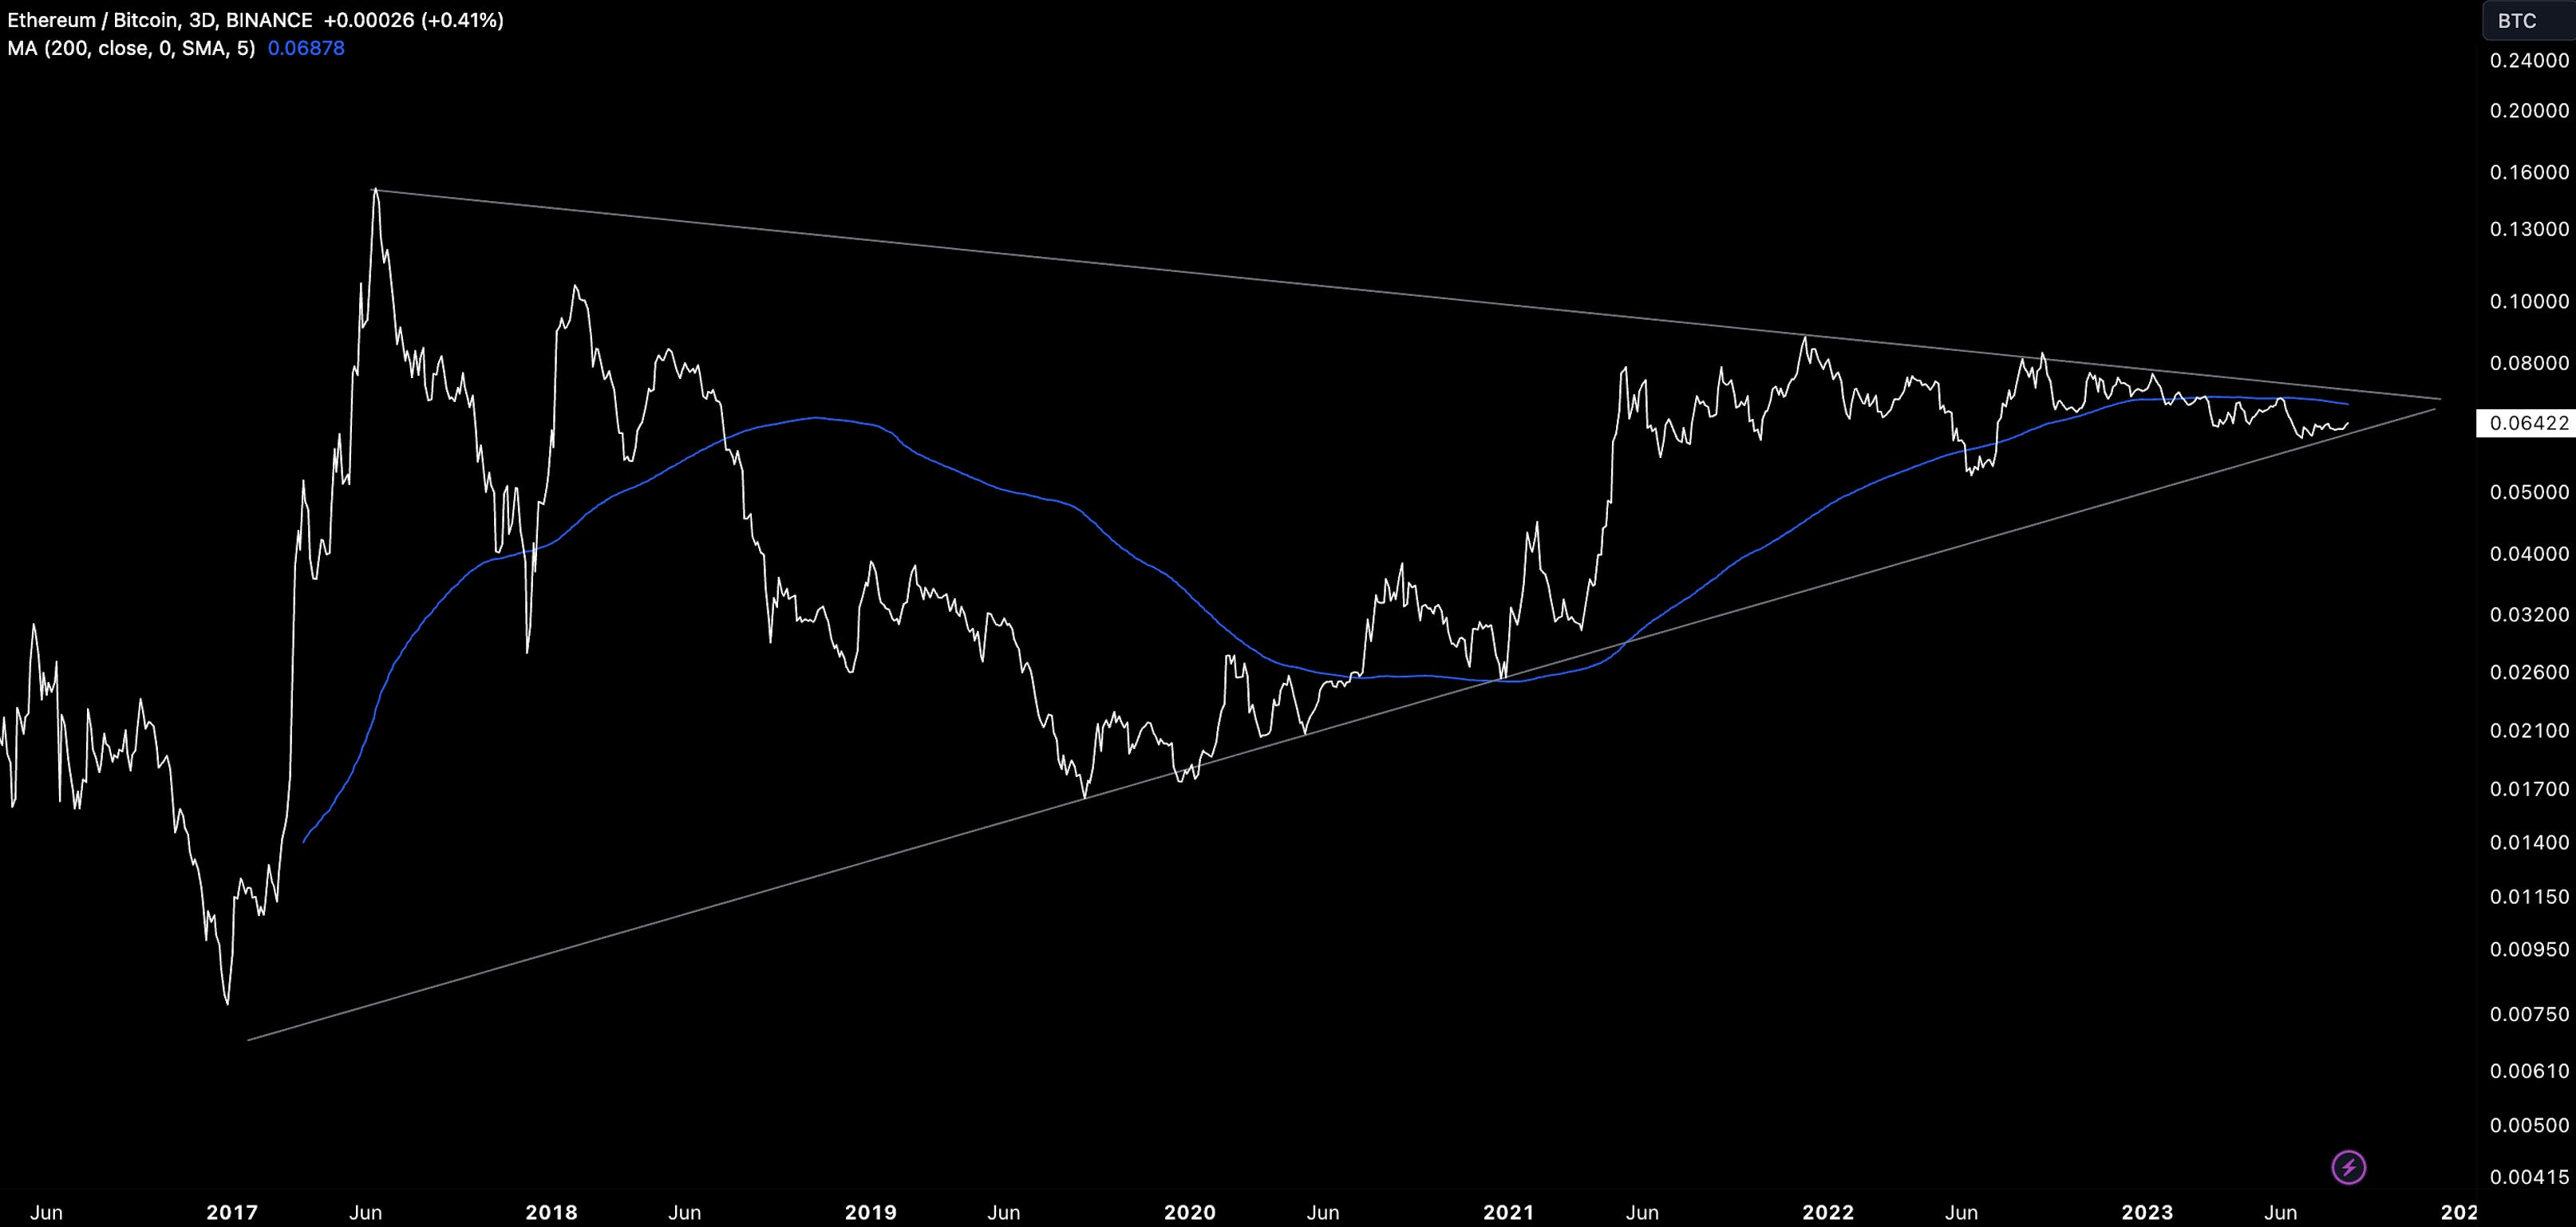
Why is this important? These dynamics inform the relative performance between assets. After wicking down to its June 2023 support of 0.06 on Thursday, the ETH/BTC ratio rallied ~6.7% in a sign of resilience.
ETH also wicked down to its wedge low…
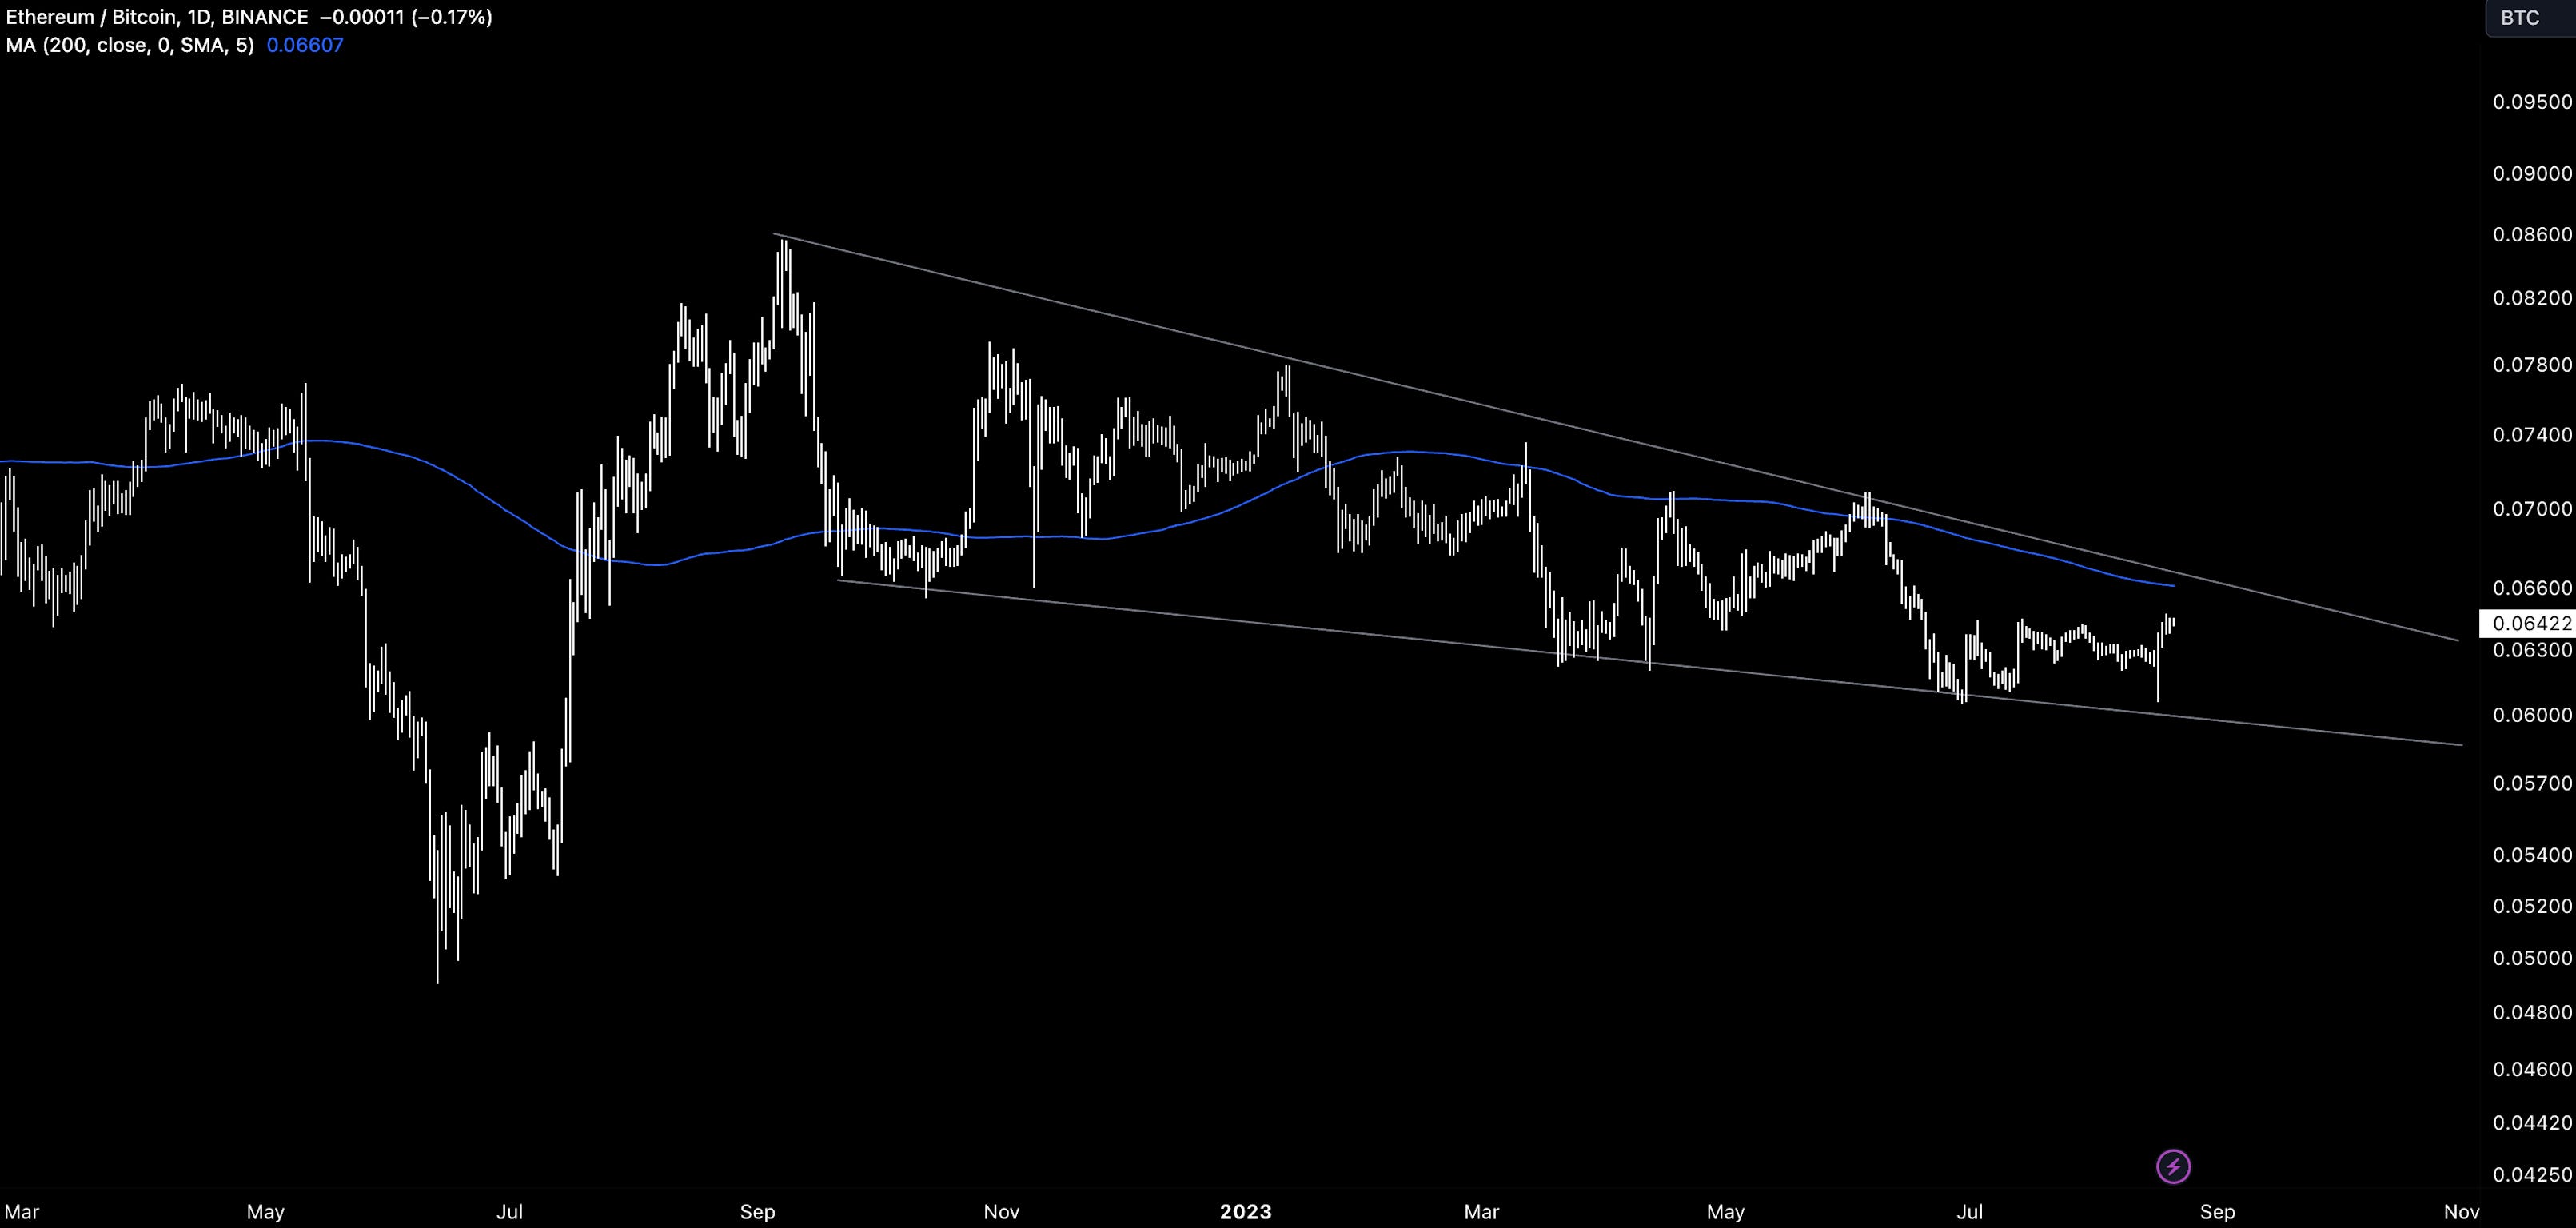
While zooming out, the move was insignificant with the ratio still within its bullish wedge formation.
So we have a low activity but bullish market environment set up for a high-vol move. There were a number of catalysts that likely all worked together directionally to cause prices to break key levels which, in turn, drove further liquidations for caught-out traders:
Catalyst 1: US Spot ETF
It seems the market was realising the SEC approval of a BTC spot ETF isn’t imminent as thought.
The prospect of the SEC approving a Bitcoin spot ETF was the key catalyst for BTC’s rally towards $31k - particularly after BlackRock stated its interest. But the timings for the approval were anything but clear.
The slow grind down for BTC wasn’t helped by Ark 21 shares application being delayed by the SEC earlier in August.
More recently though, the break below $29k came a day after realisation approvals could take as long as March 2024 for filings made in July 2023. After $29k broke, the liquidations started coming in harder.
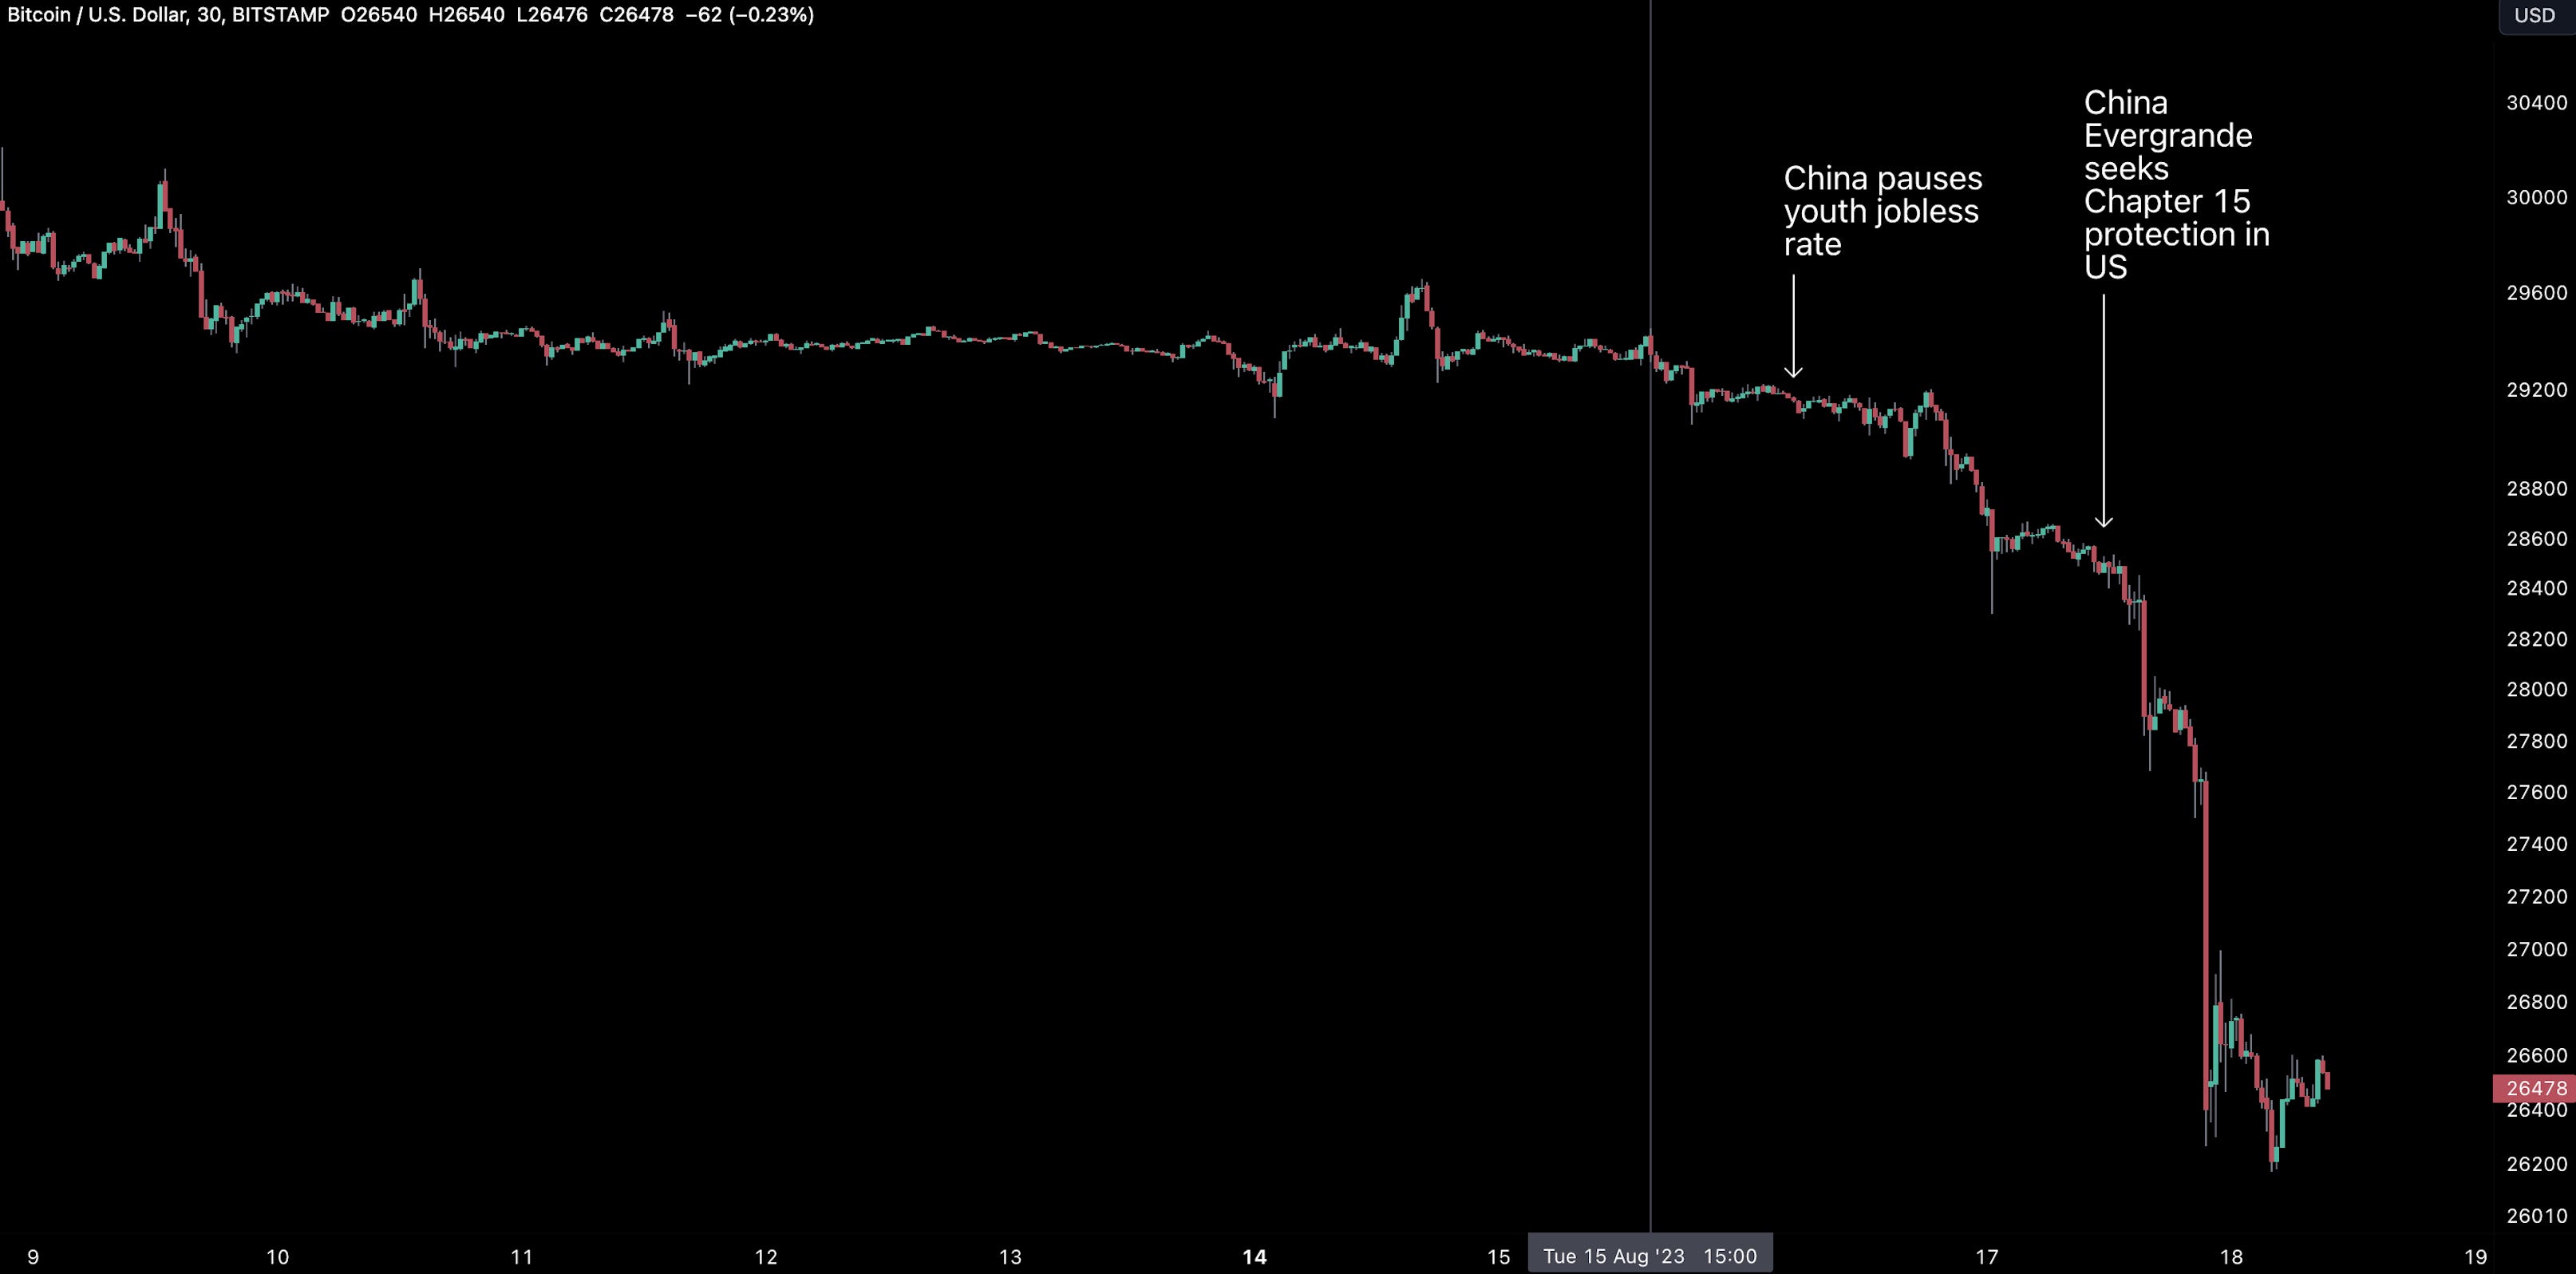
Catalyst 2: Economic Downturn Data
The latest economic data from the largest economies are signalling economic downturns that renewed fear in investors that have tapped out for the summer holidays.
China’s PPI fell for a 10th straight month, contracting 4.4% in July. And this likely speaks to a broader trend of deflation that points to weaker economic recovery.
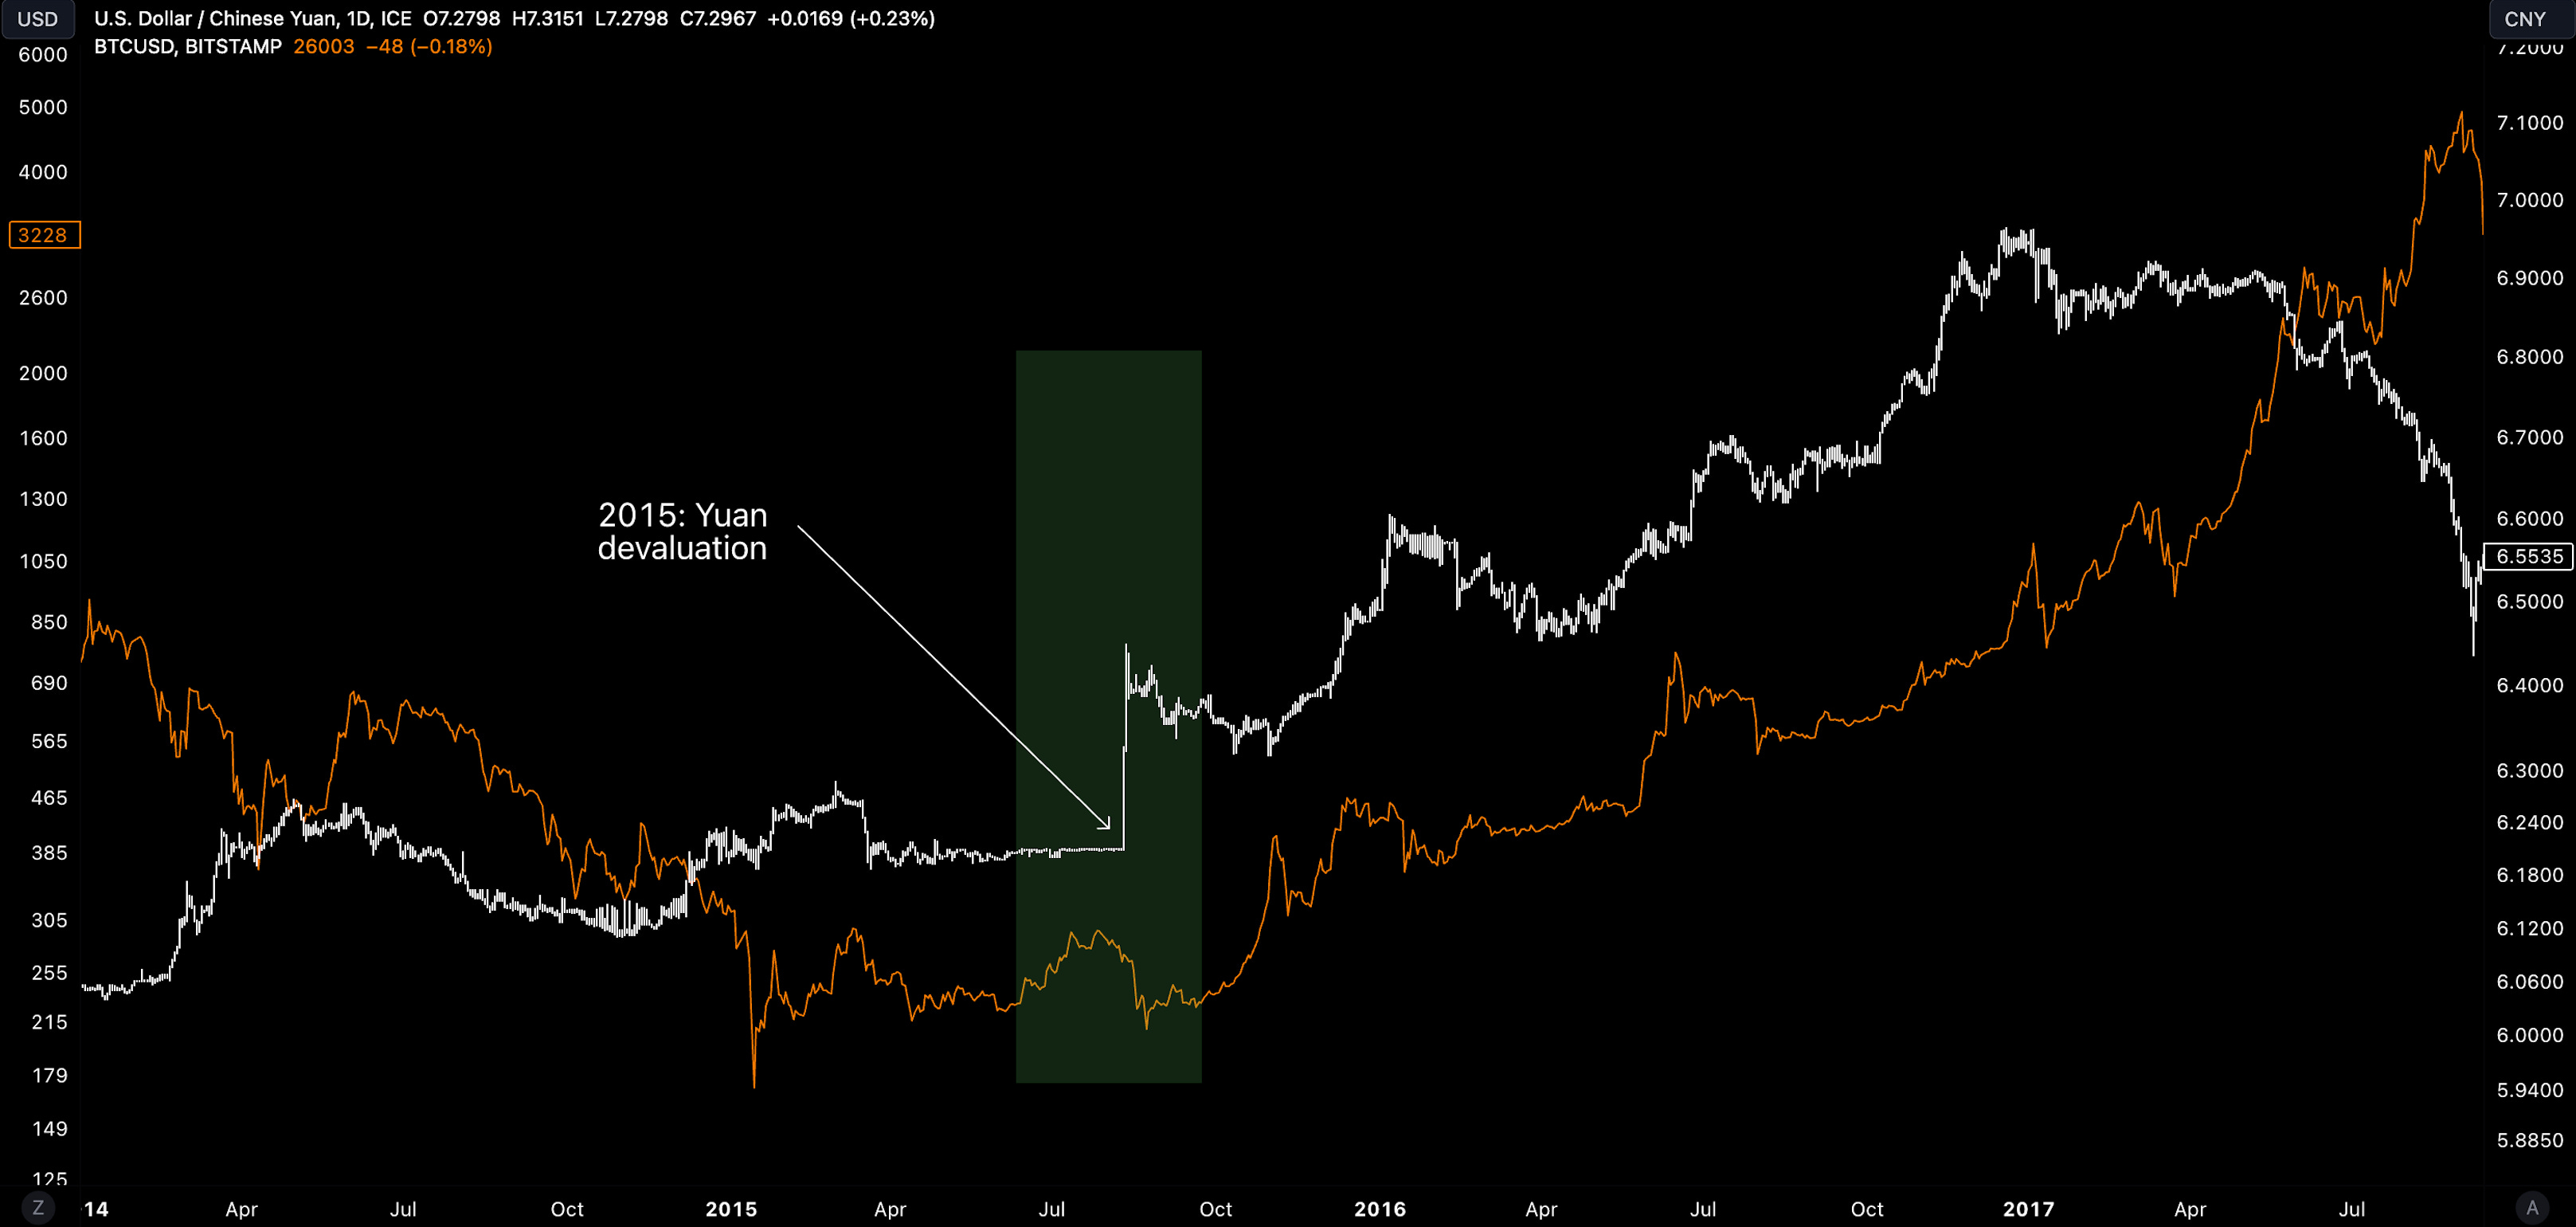
Risk assets like crypto face the prospect of Yuan devaluation - trading at its lowest since 2007. In 2015, BTC declined 23% when China devalued Yuan for the last time.
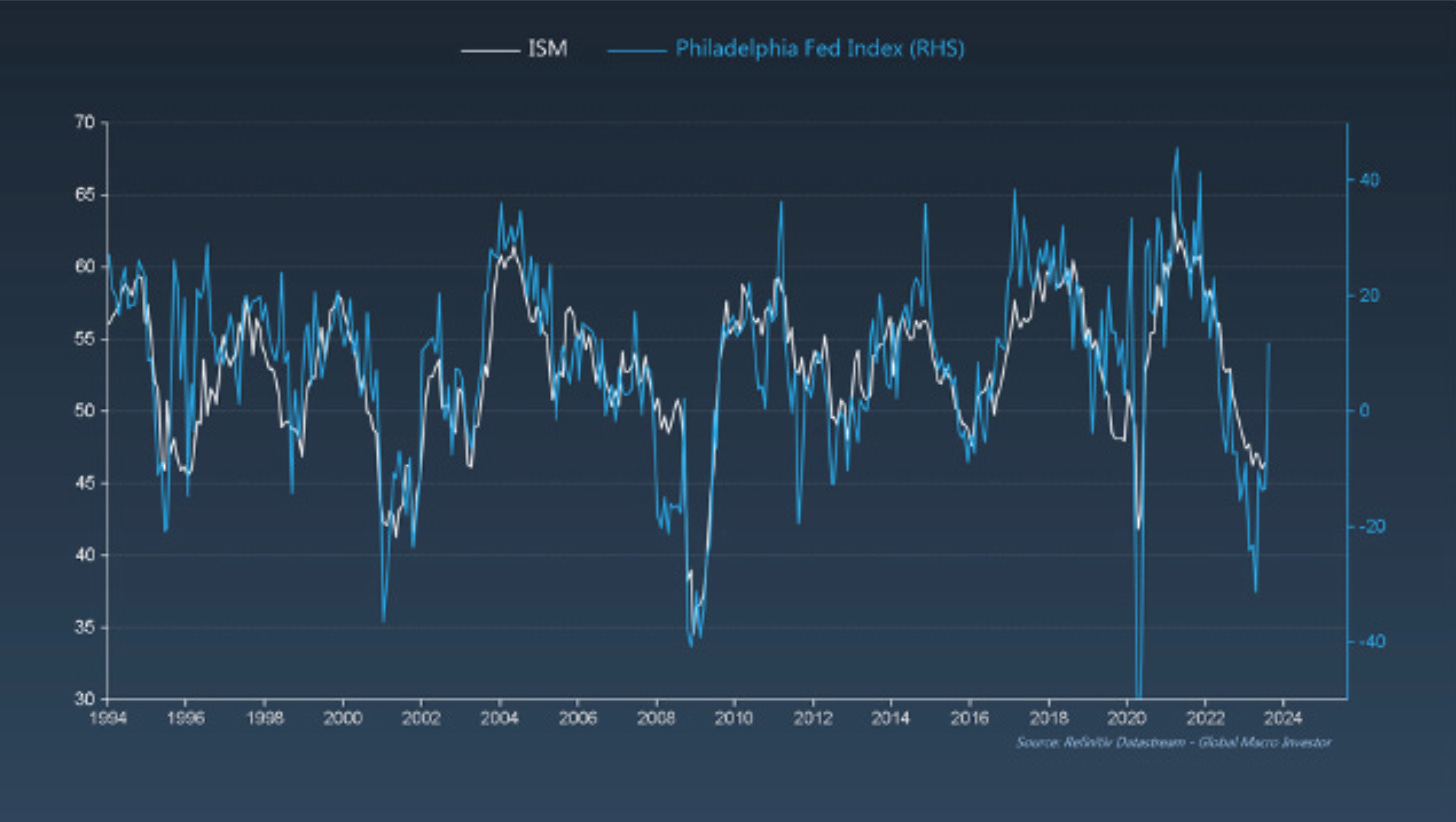
Yet, the irony is economic downturn may not be as clear-cut as everyone is believing now. Leading indicators for economic activity in the US are pointing higher, not lower with Philly Fed data rallying higher last week after being in deep negative territory.
Catalyst 3: Higher Rates For Longer
The Fed remain cautious on severely lagging inflation data so they can keep a restrictive policy for longer in order to overshoot inflation.
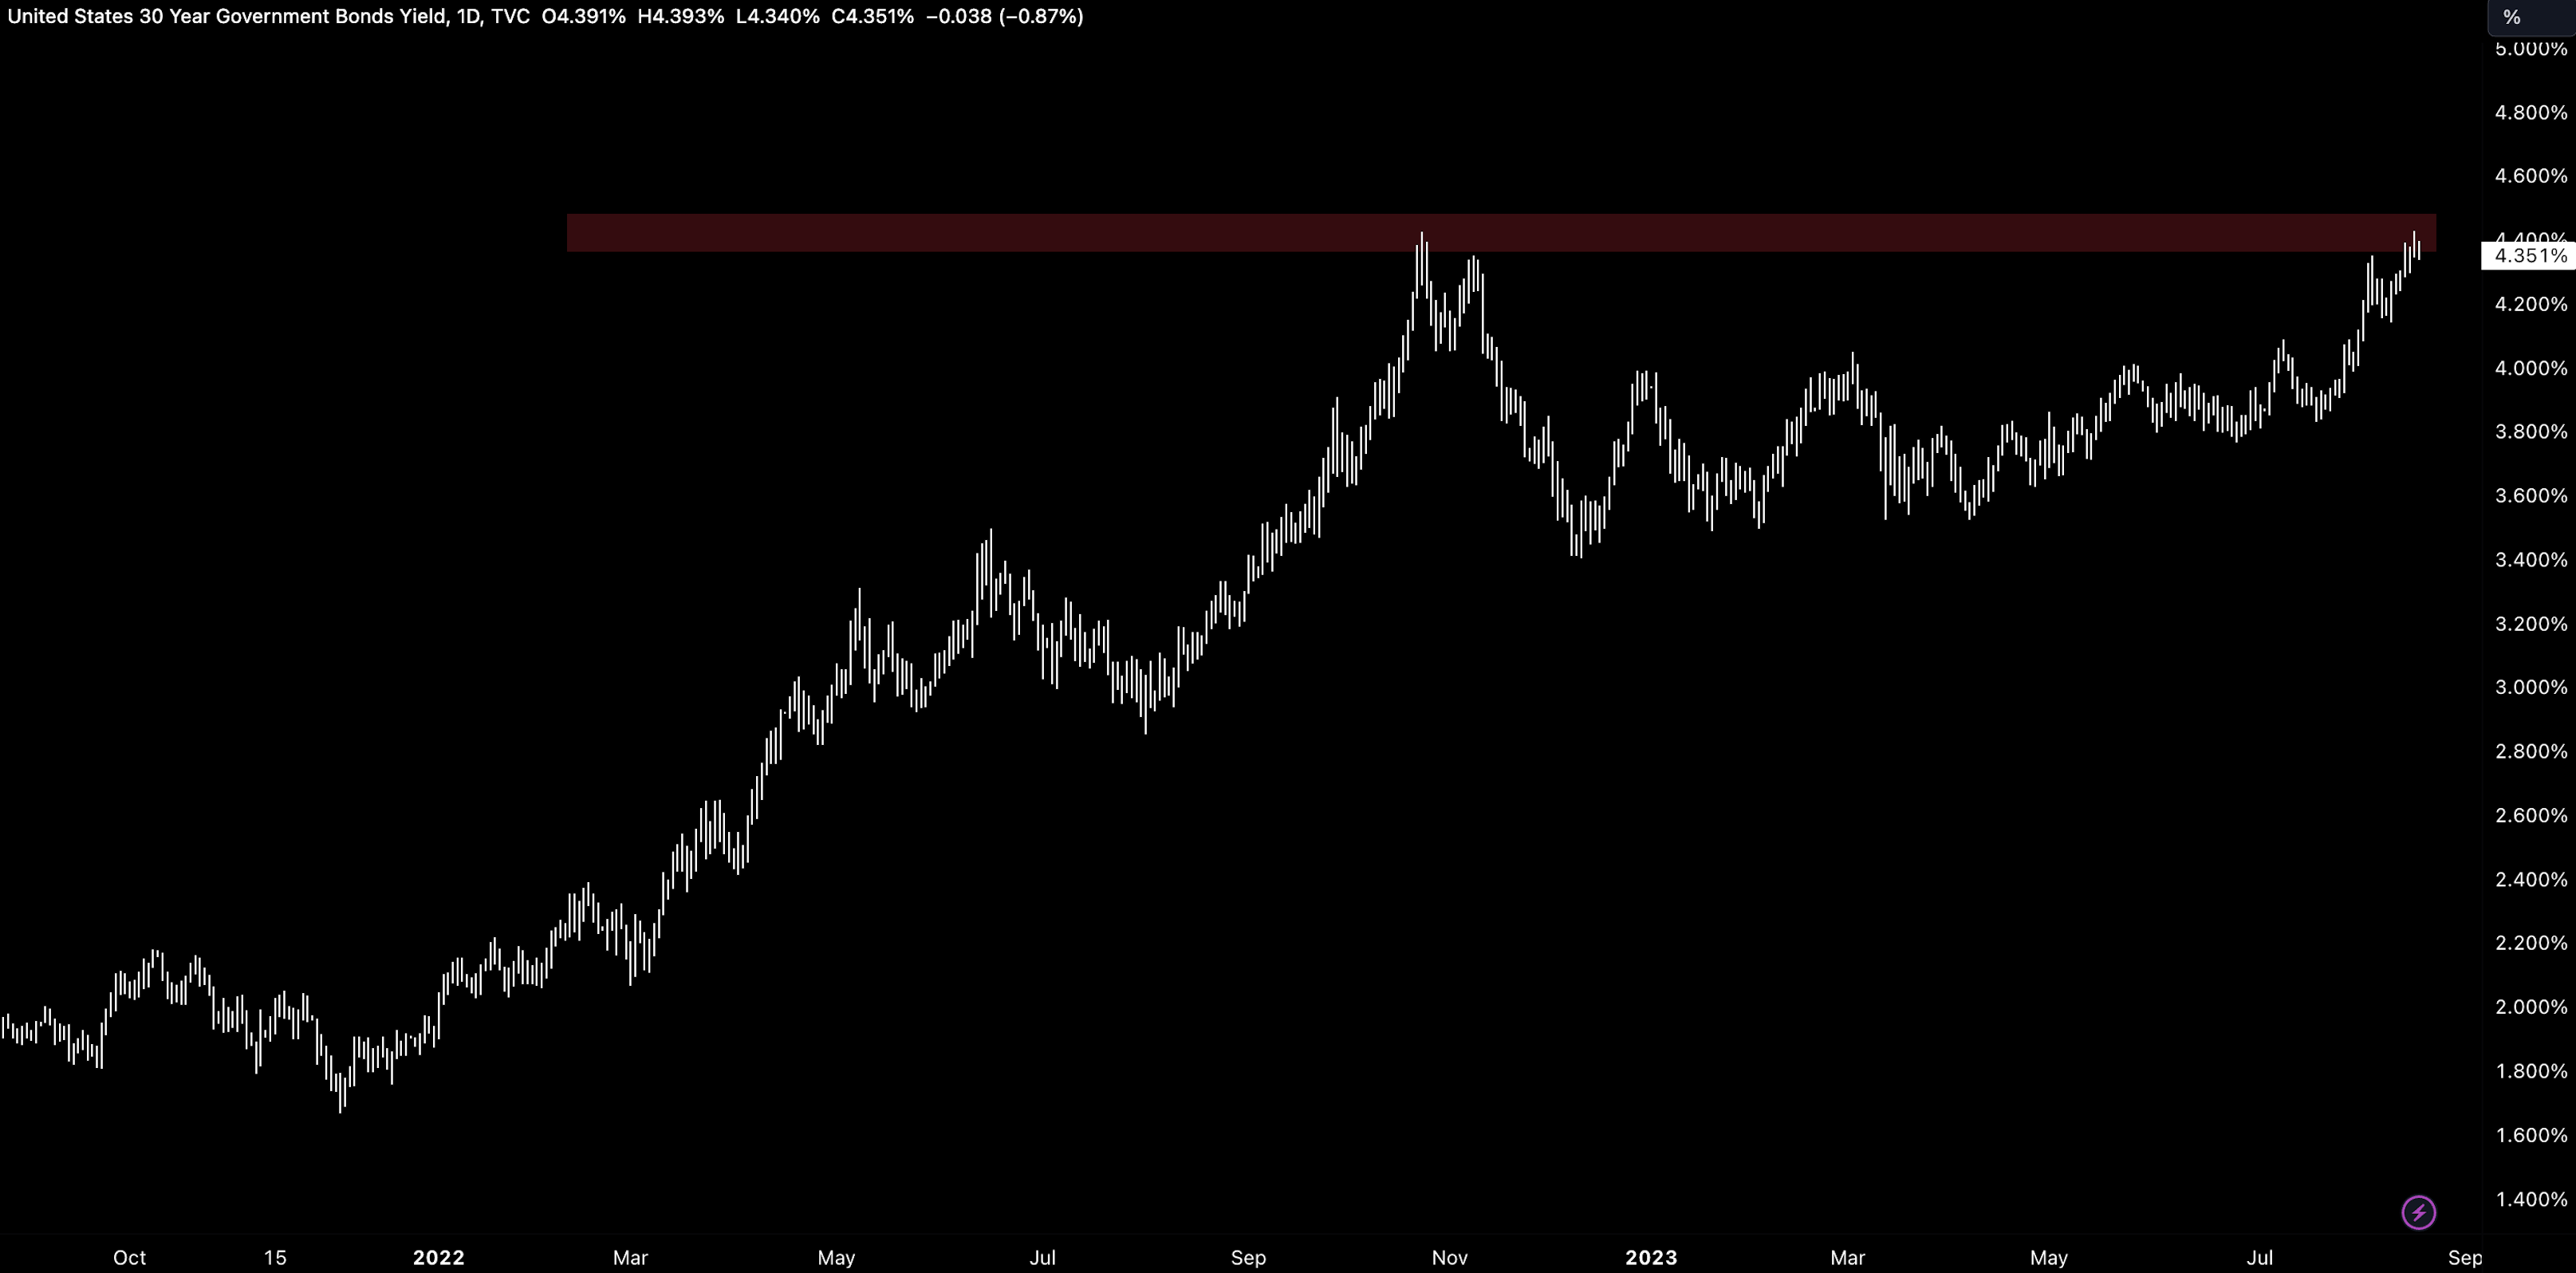
July FOMC meeting minutes pointed to their openness about raising rates even further to tackle prices. The US30Y rates also hit their highest level in 20 years as rising yields weigh on risk assets more broadly with NDX now down 8.6% from its July peak.
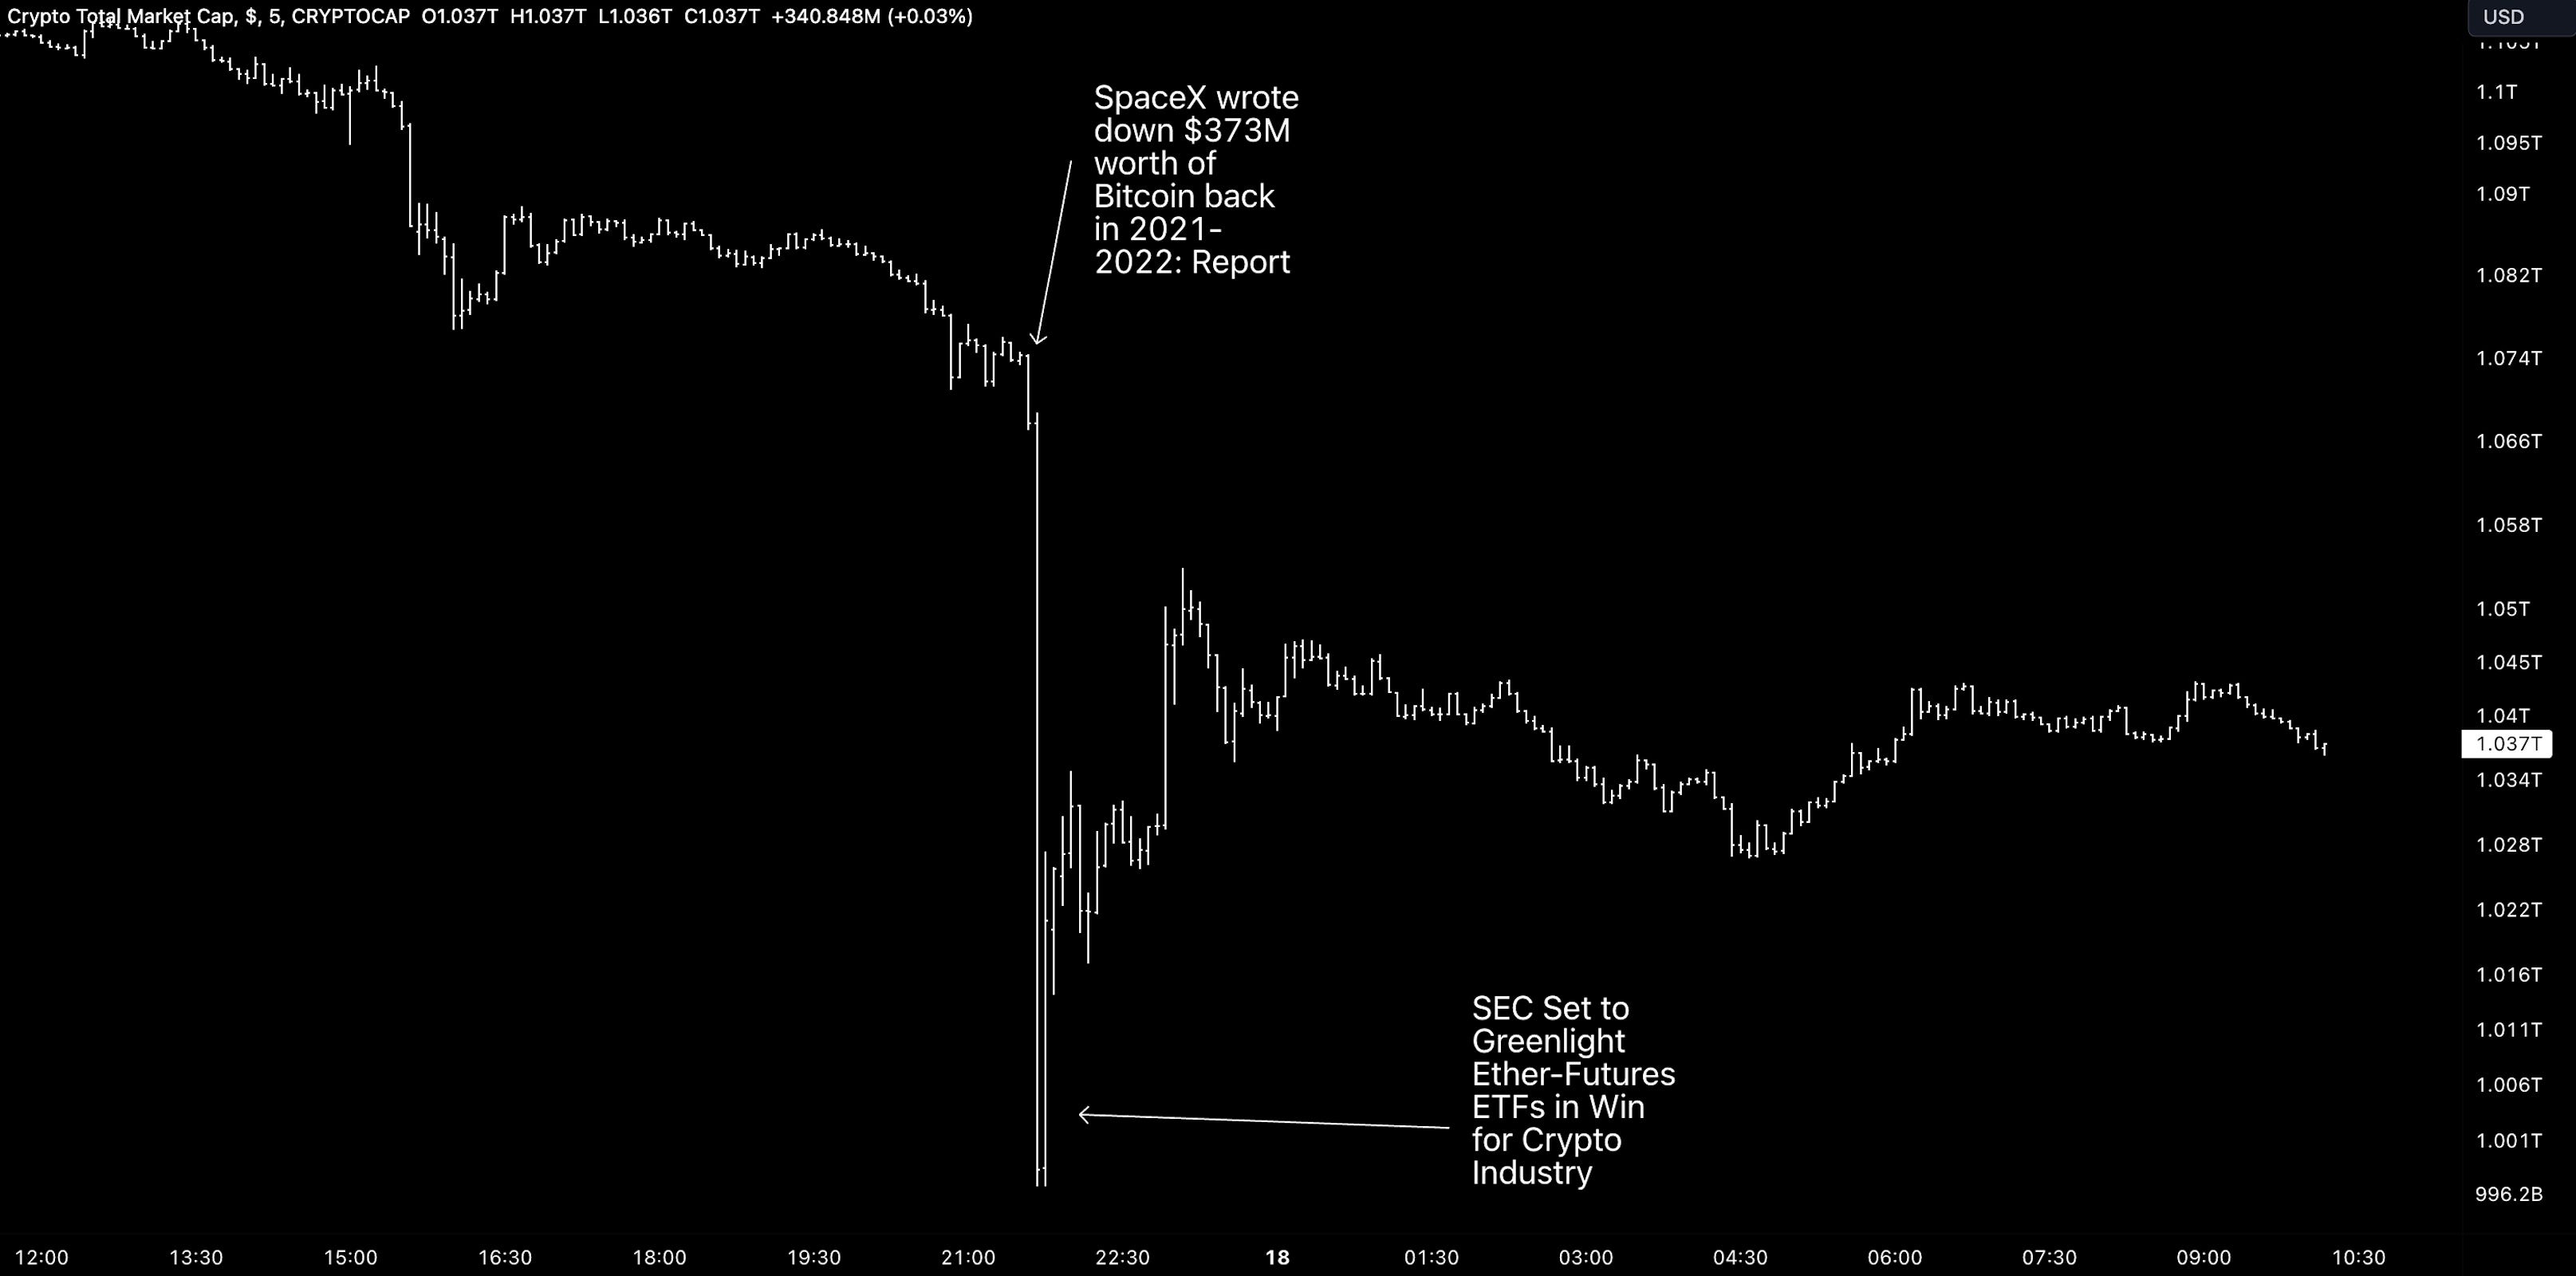
Catalyst 4: SpaceX Writing Down BTC Exposure
It was reported late on August 17th that SpaceX sold all of its $373m BTC but further reports added confusion to what actually happened.
The key point here is the headlines only added to the souring sentiment. After immediate sell in the market, the headlines around the SEC potentially set to greenlight Ether futures ETF was the reversal catalyst the market was looking for.
Out With the Old, in With the New
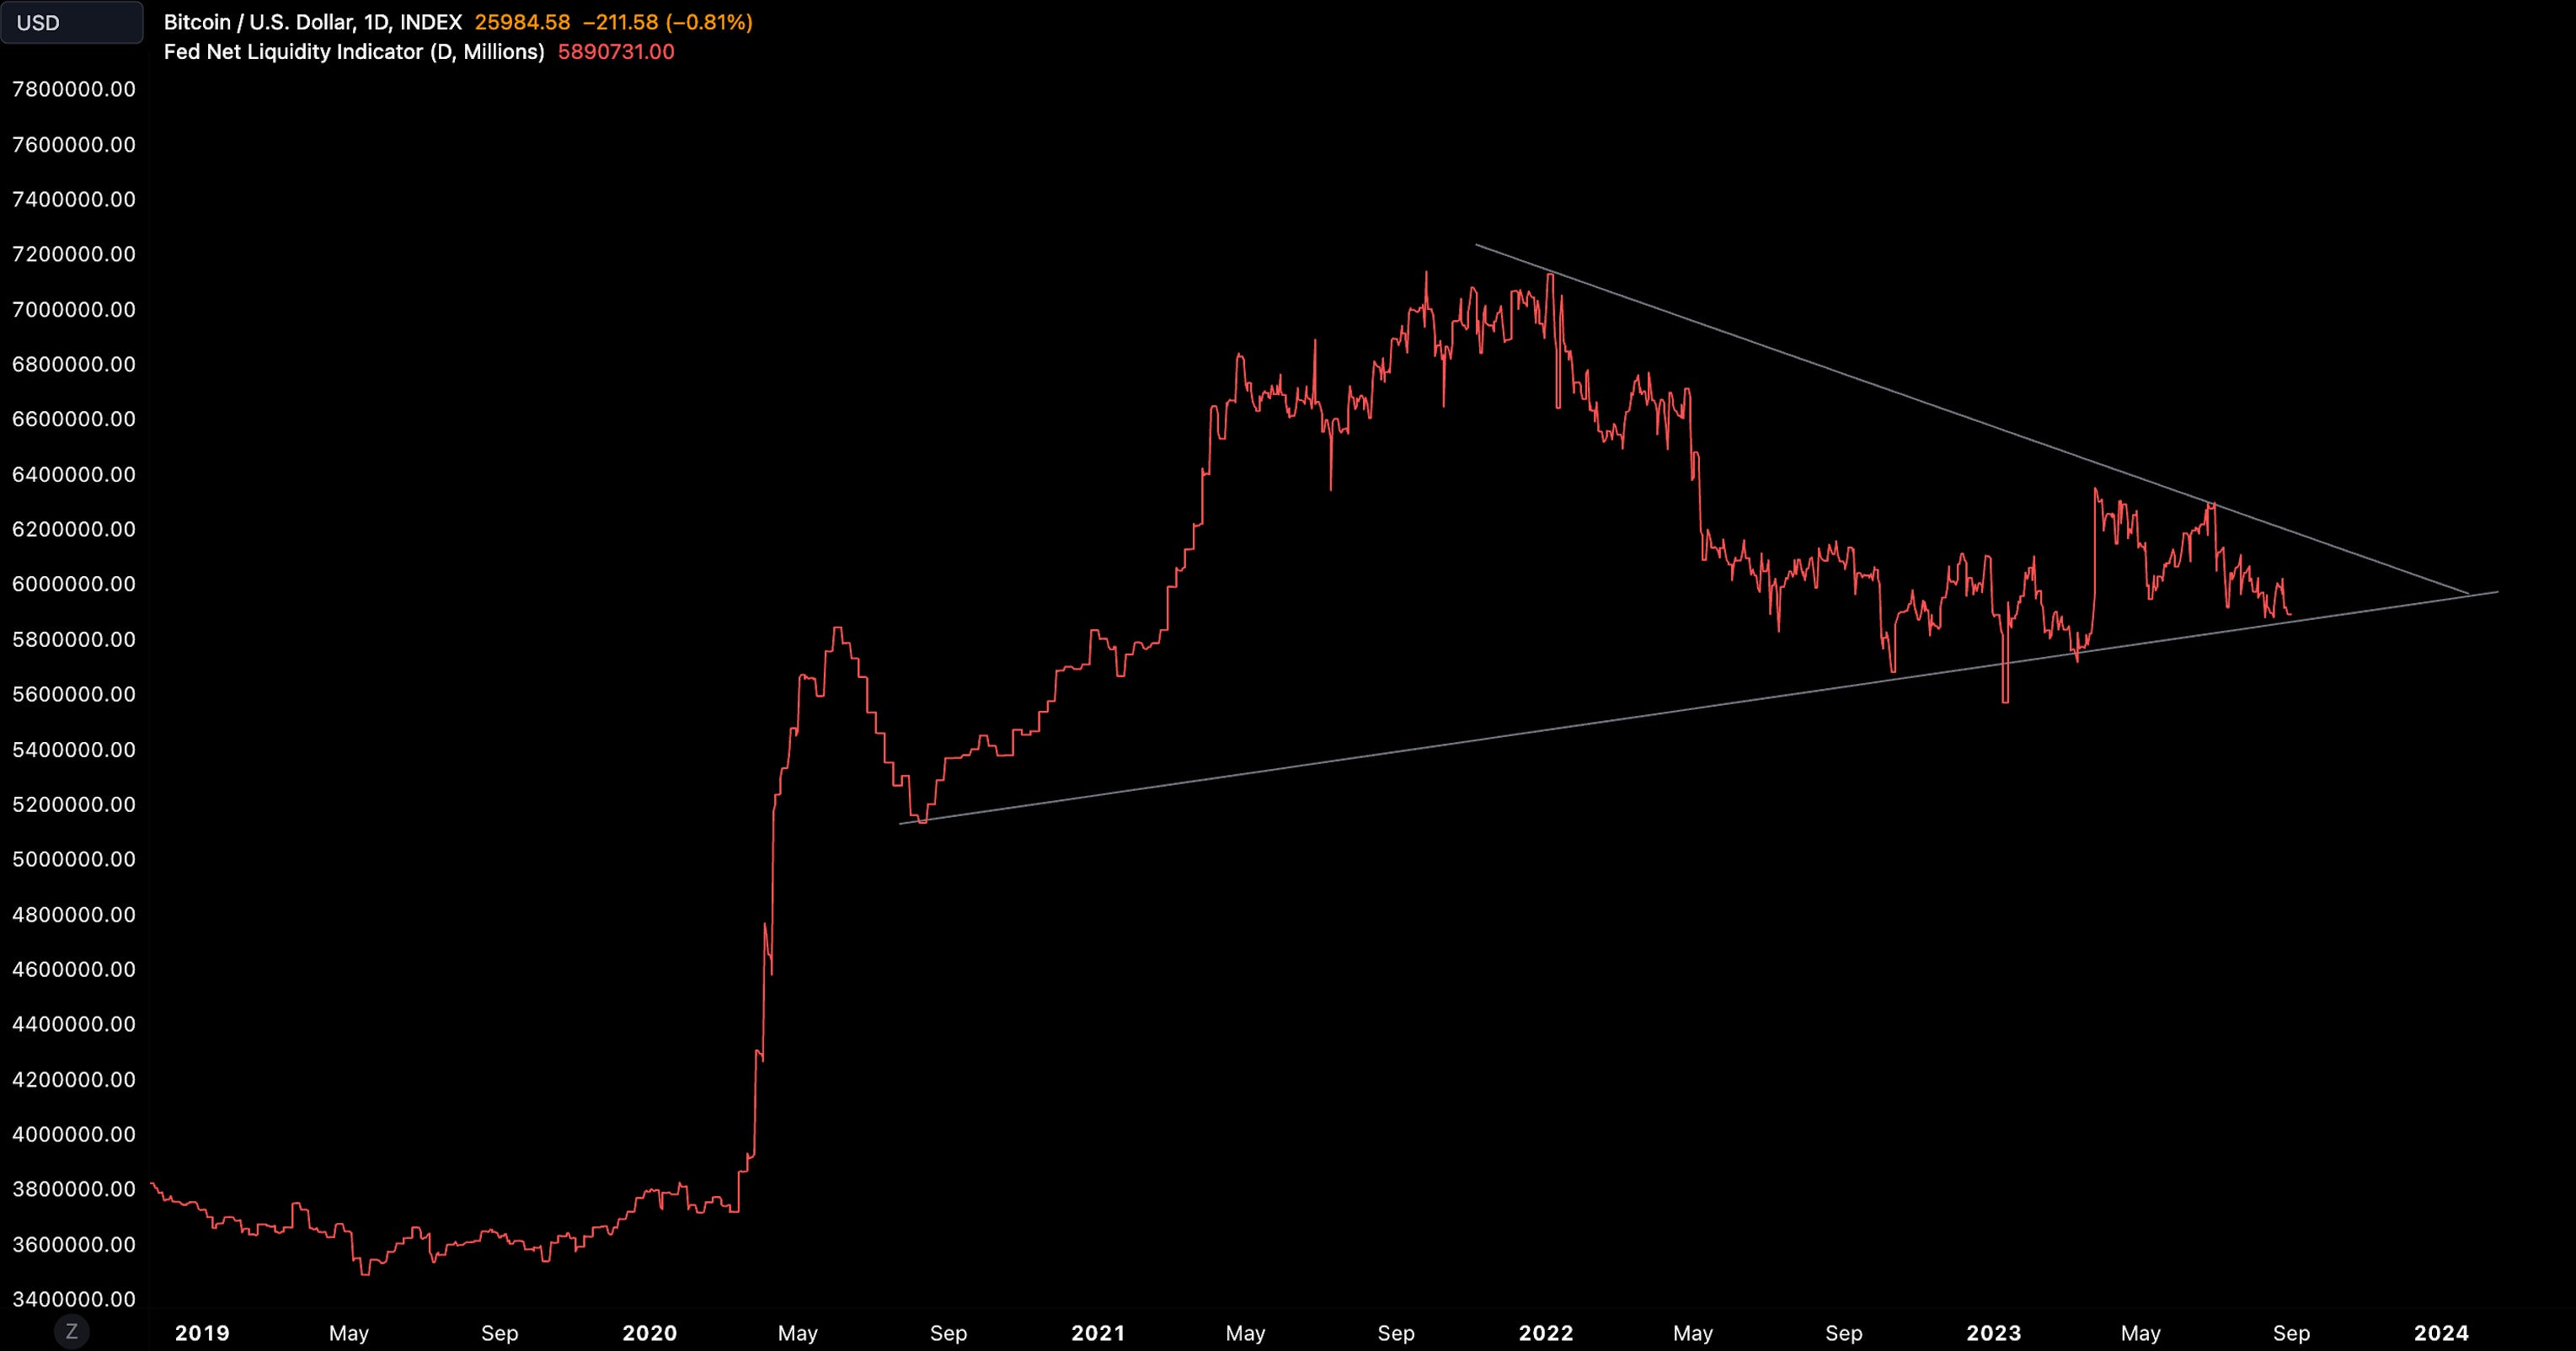
So where are we today? The move in risk assets aligns with the broader liquidity trends. High-growth tech and crypto are finally gravitating towards liquidity-fair value (e.g. NDX at 11,400).
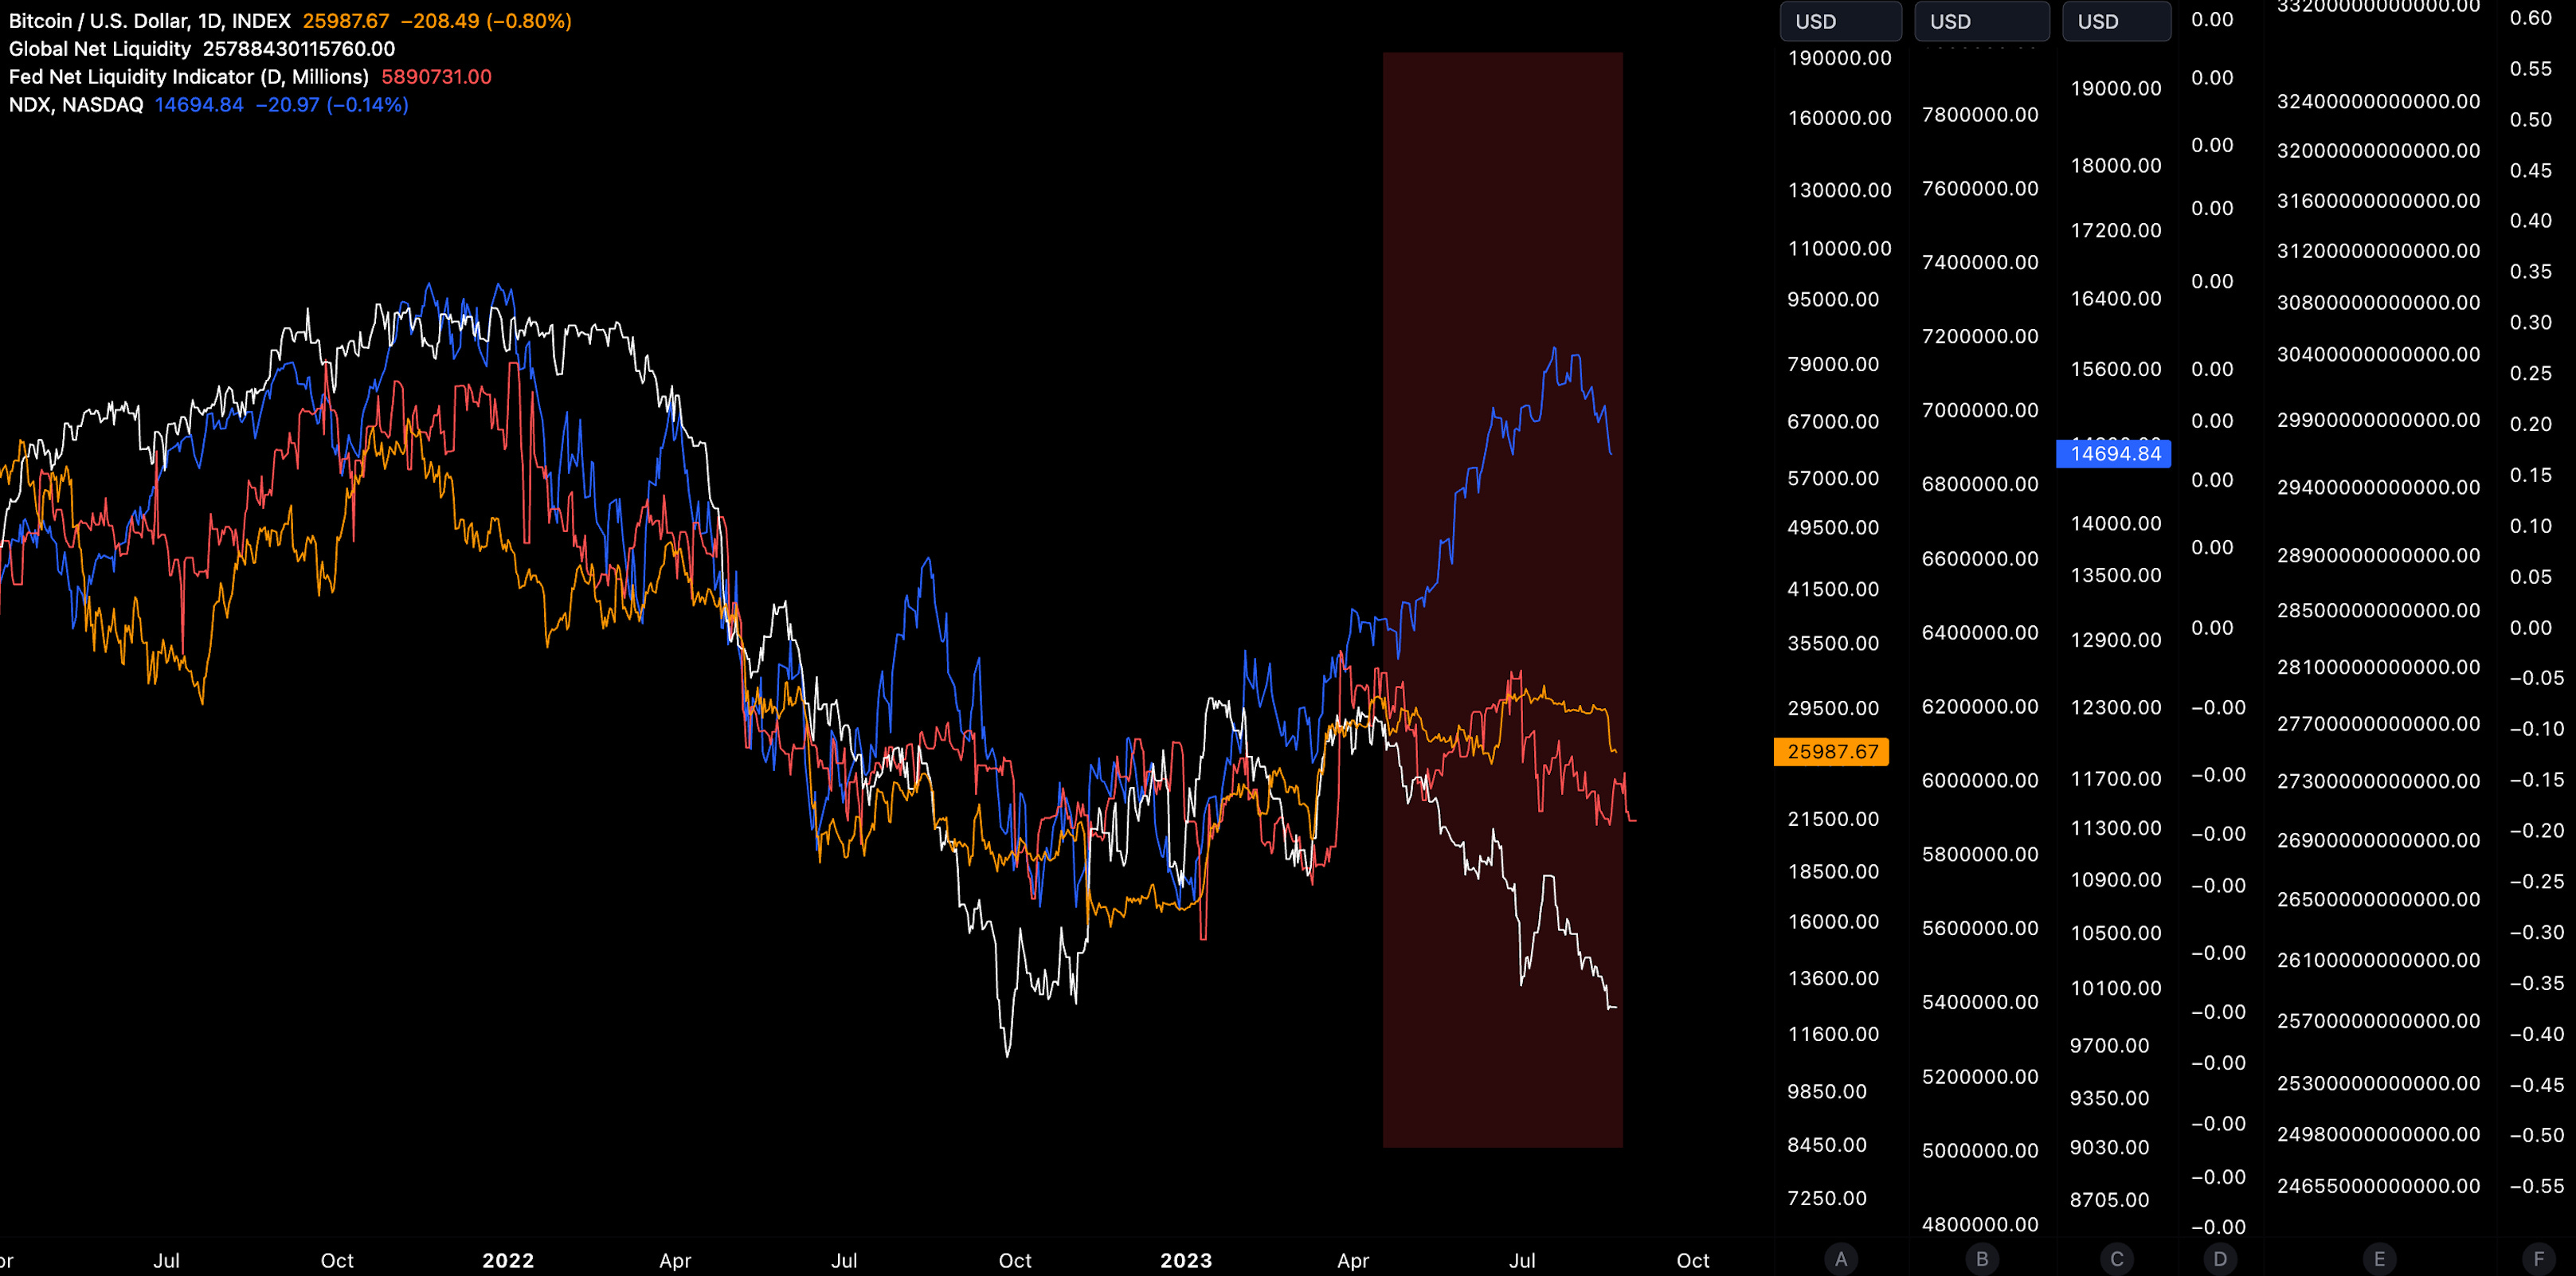
But as markets that discount the future, the pull-down may not be so extreme - instead only re-rating to a minor degree after front running the liquidity cycle longer-term.
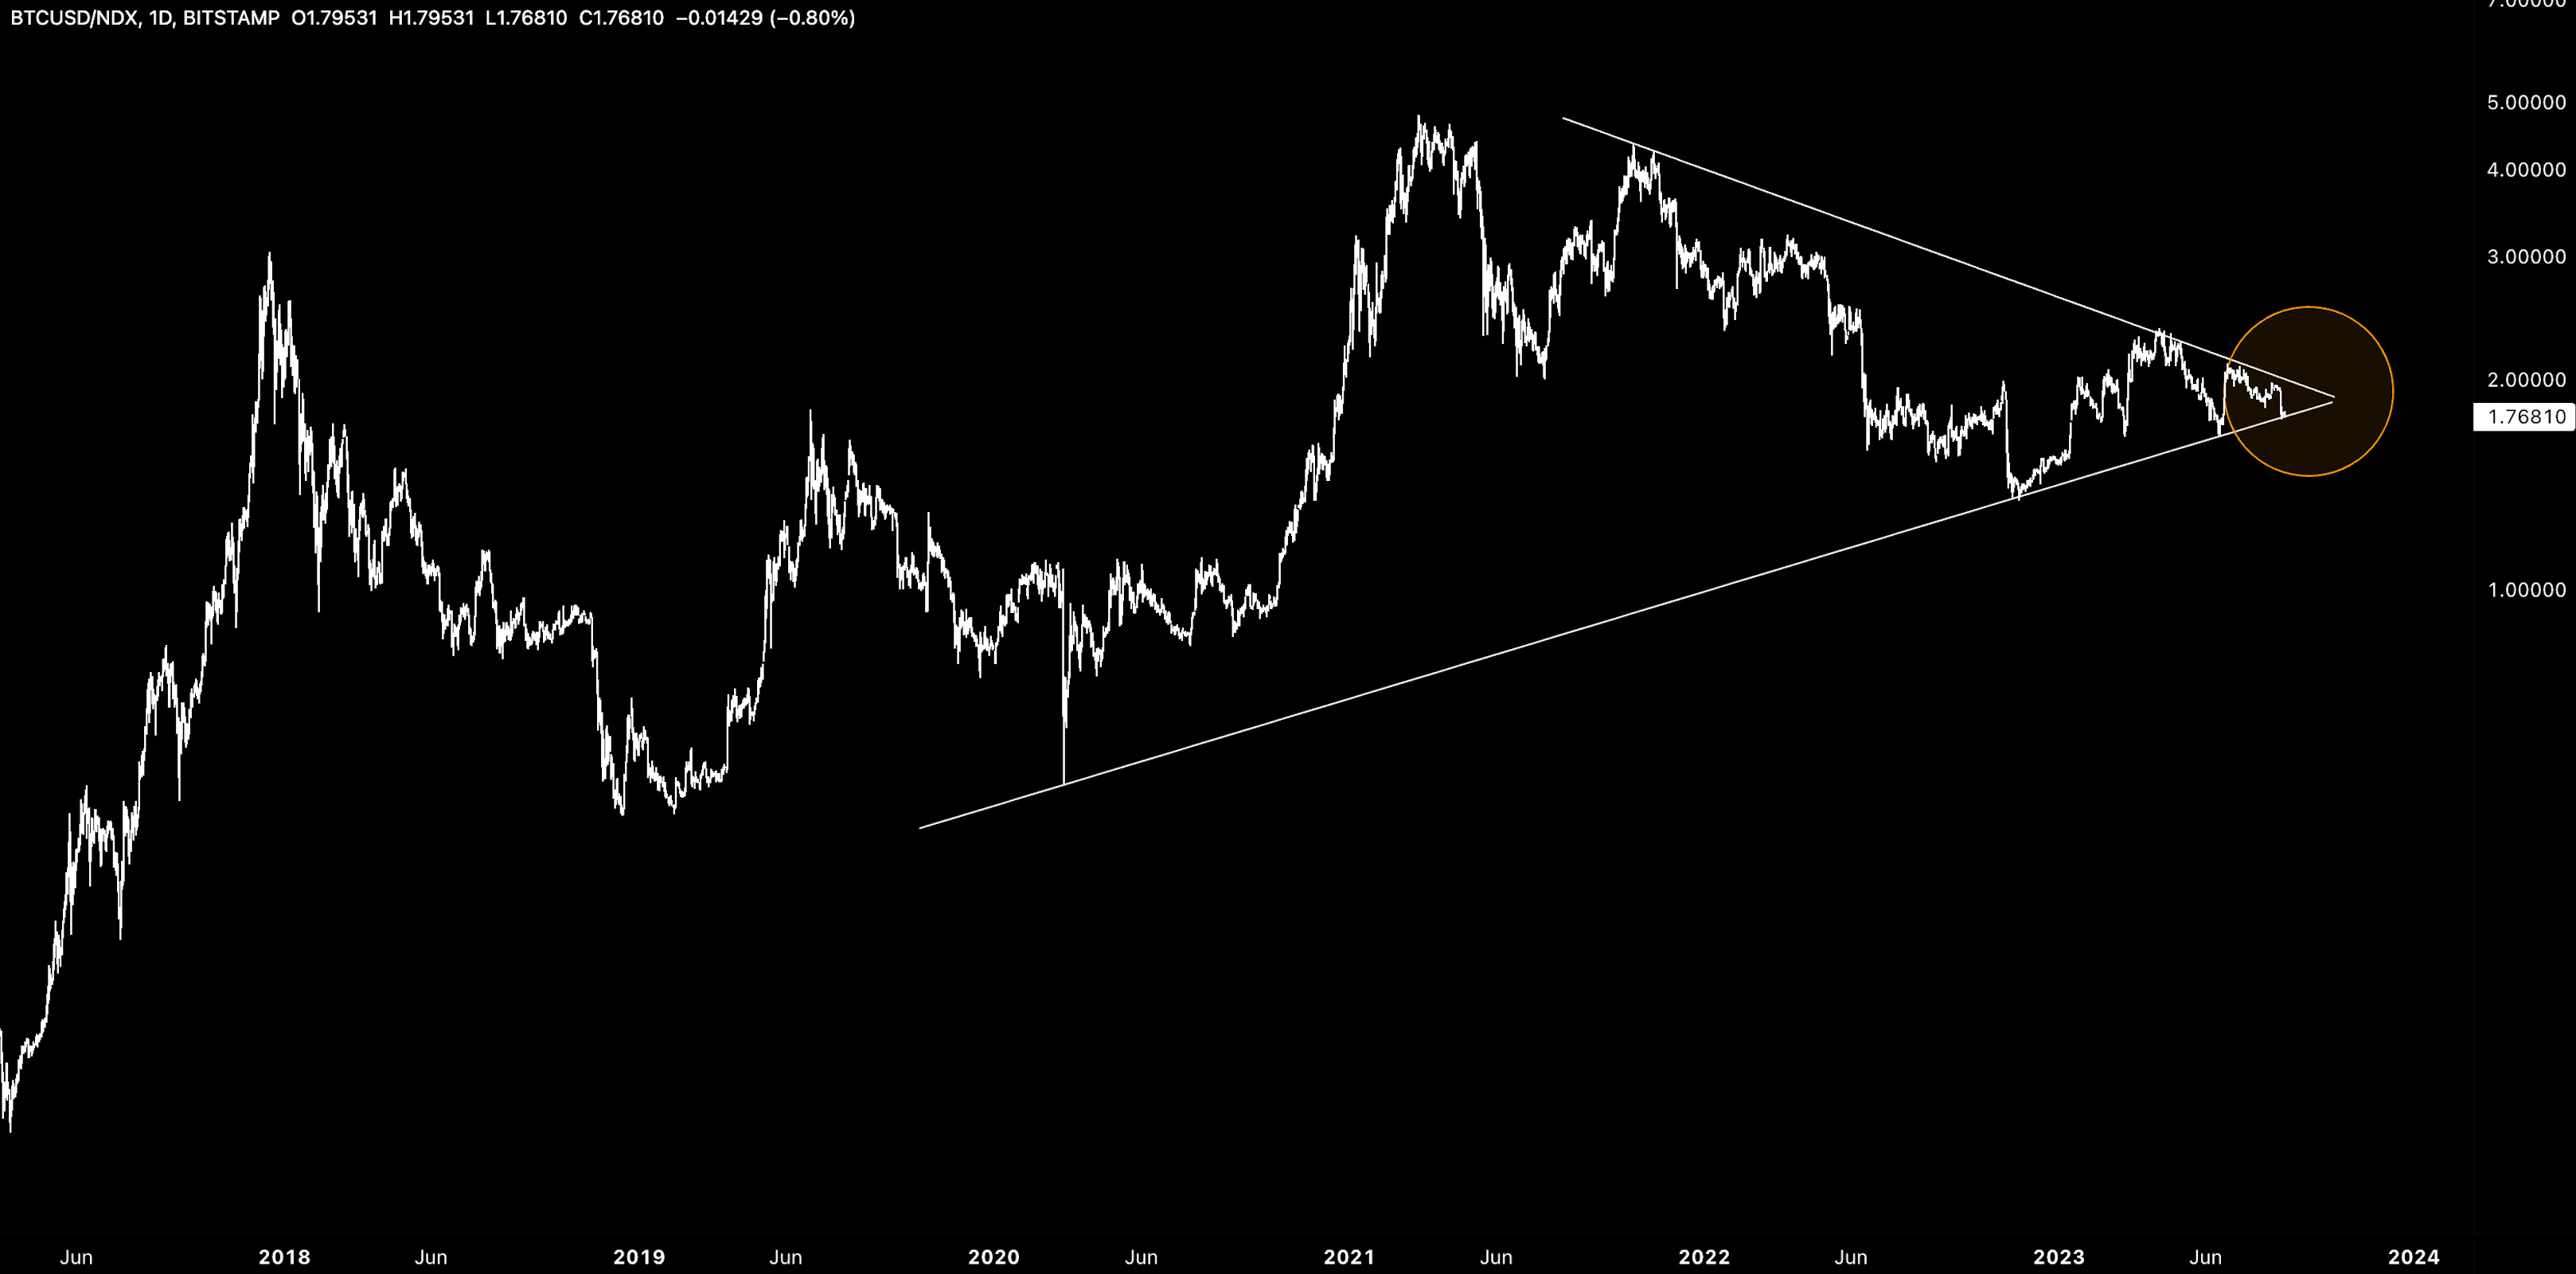
NDX also stands to fall more than crypto through this lens. Even with last week’s price collapse, the BTC/NDX ratio remains constructive.
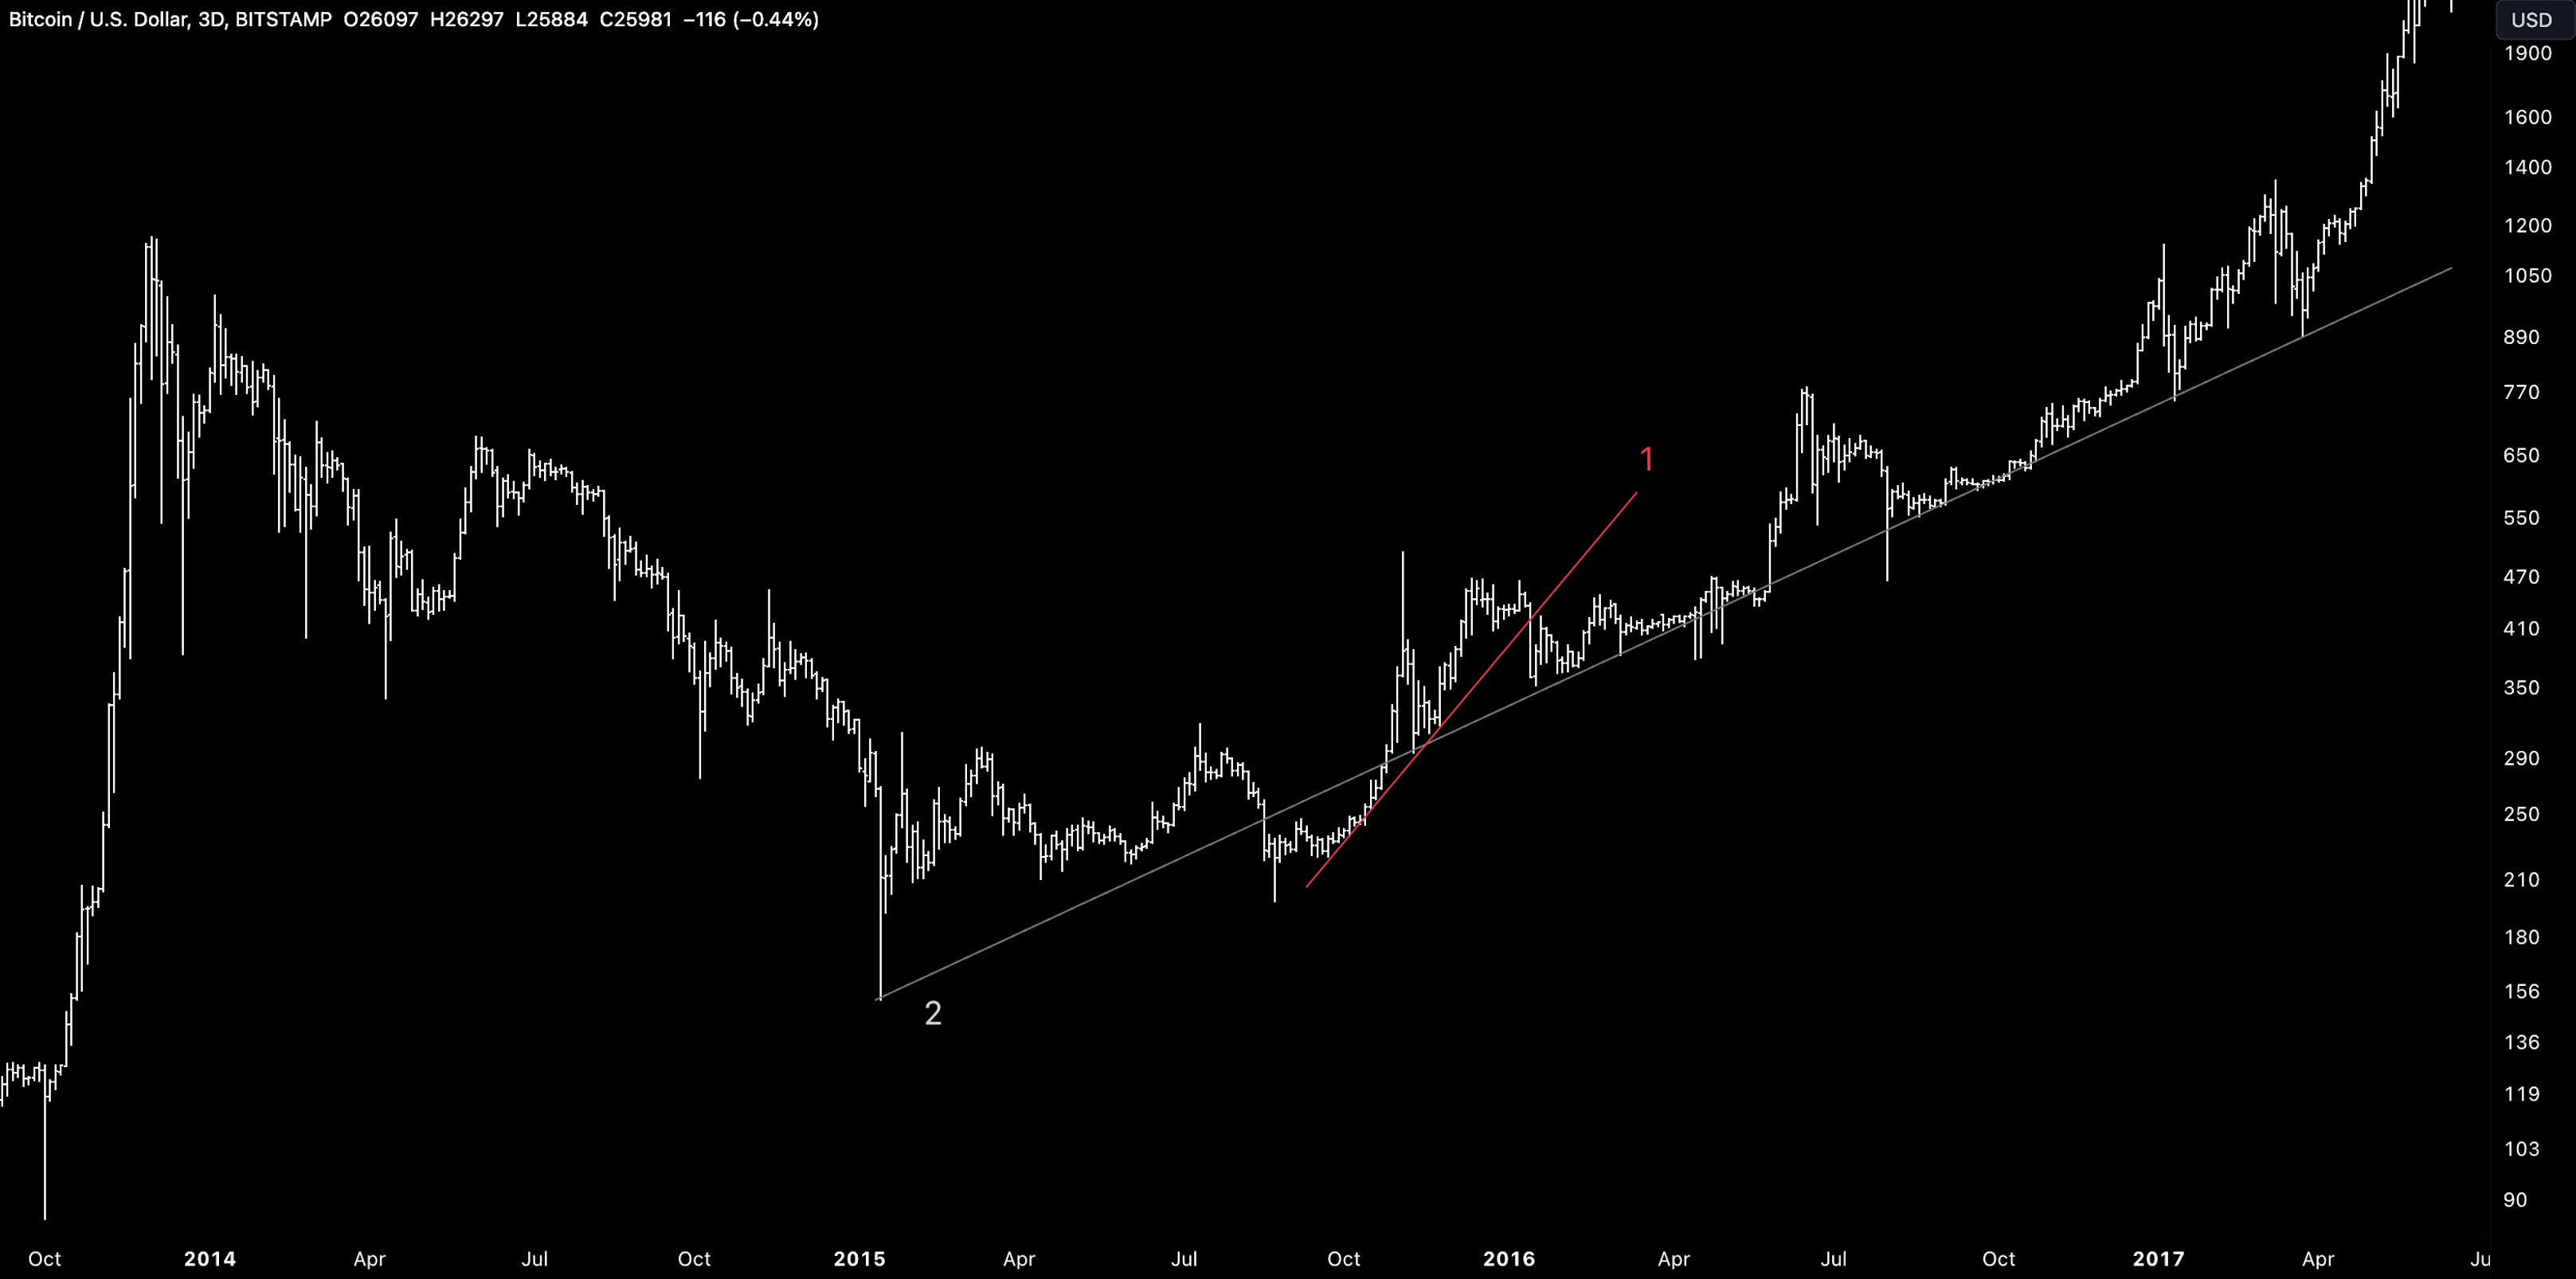
We can also see BTC’s recent aggressive run-up as one that breaks (red) during the early innings of bull runs and keeps support at a more sustainable pace (grey).
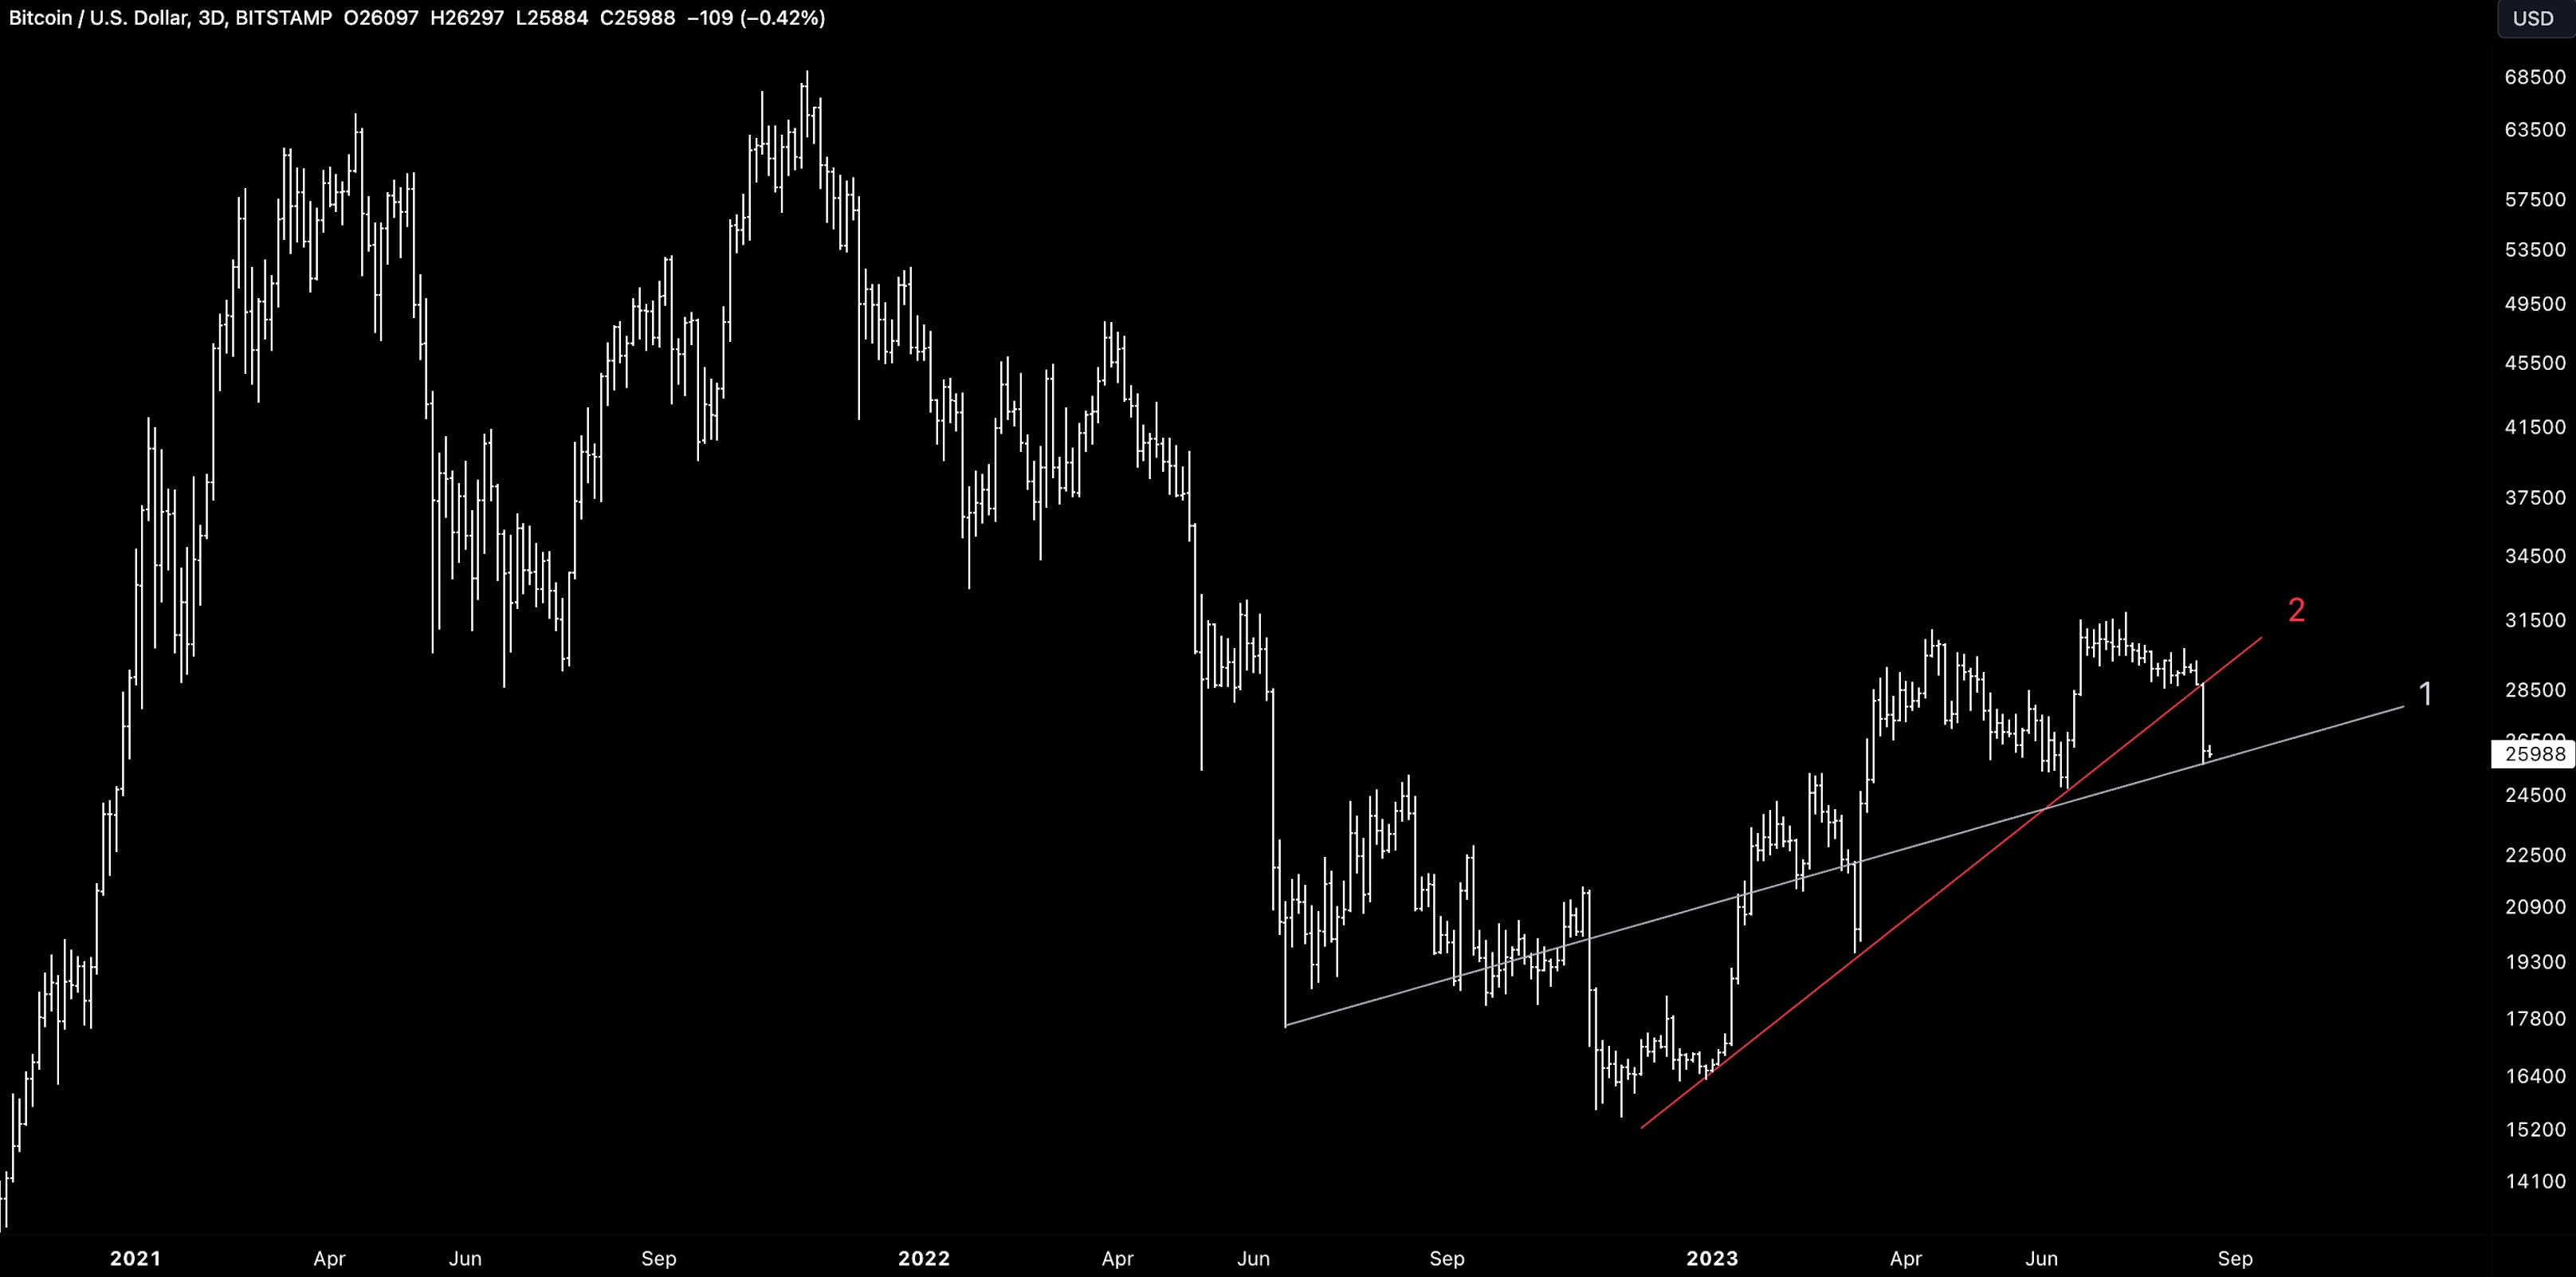
This was the case during the 2015-2016 period (below) and 2019-2020.
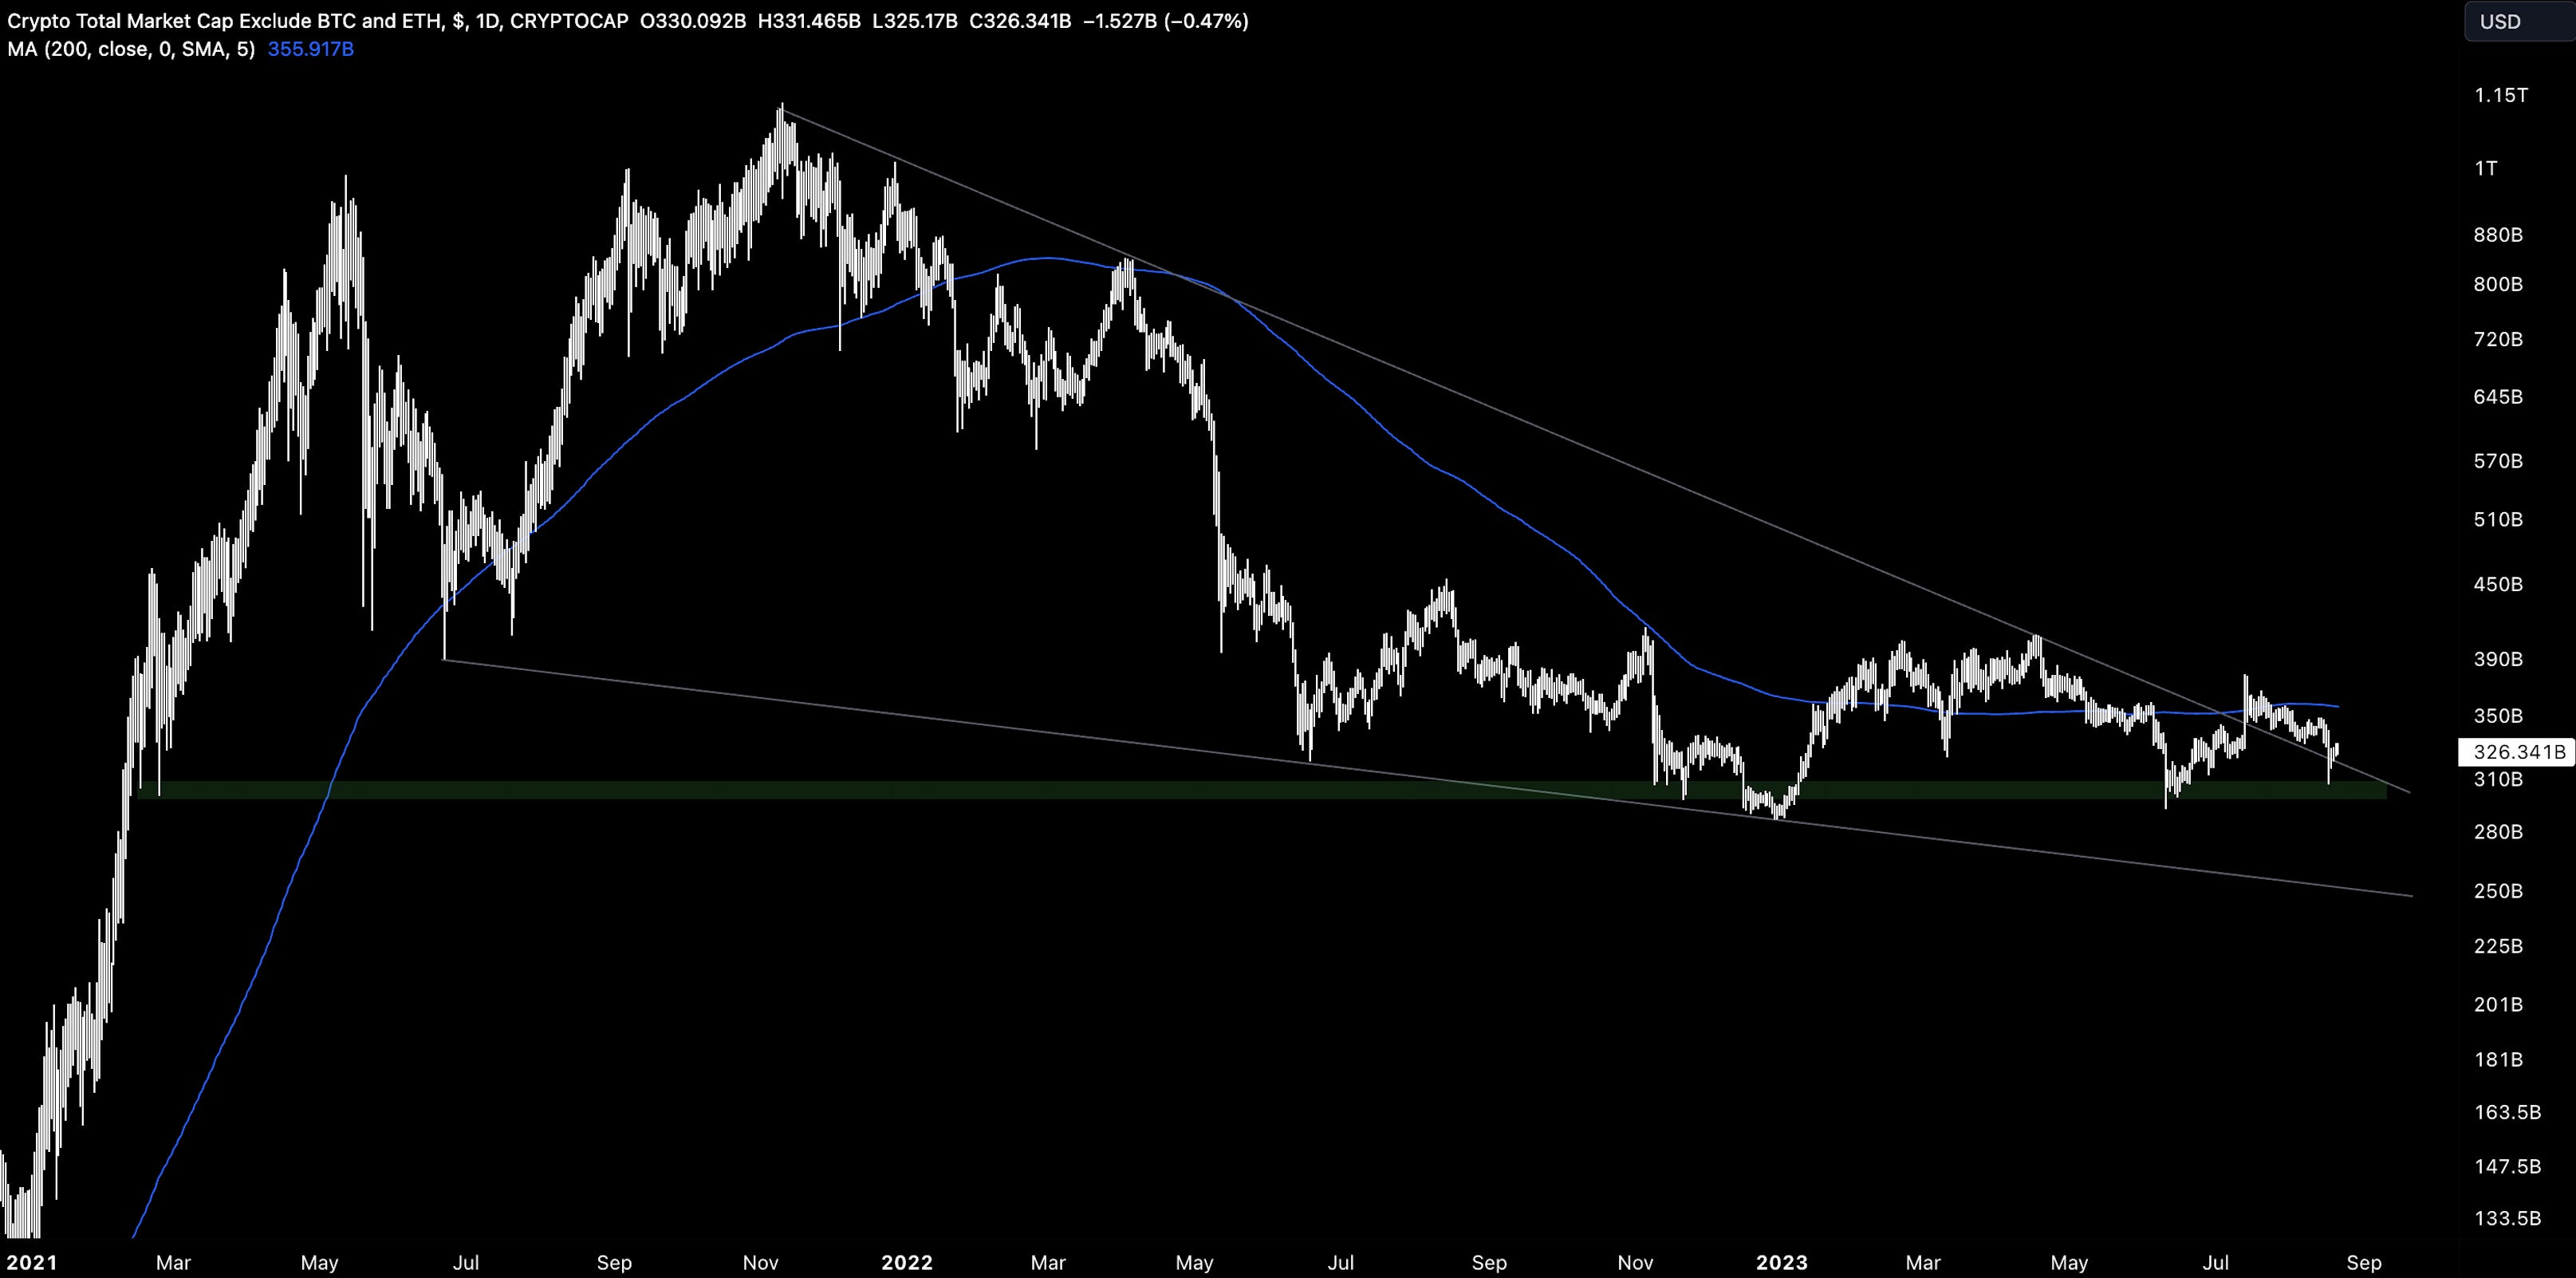
And finally, the alt coin market (outside of BTC and ETH) doesn’t seem to want to go below ~$300B in what feels like a market that has already priced significant negative outcomes last year.
All said, the recent drawdowns only align with the broader liquidity conditions and the overstretched sentiment particularly for tech had to be reset at some point. Yet, the growth outlook coinciding with disinflationary/deflationary signals aligns with the broader constructive patterns that are still holding up. It seems to be business as usual for now.
RxR First Feature in OurNetwork
RxR covered macro analysis for Coinbase’s Base protocol in OurNetwork’s latest edition. OurNetwork is a community-powered crypto analytics providing public data-driven research to over 28,000 readers.


Global Market Cap

$1.03T; Markets opening down by 1%, continuing the direction from last week. Global MCAP index range-bound between $1T and $1.24T with daily RSI signalling oversold conditions. Potential bullish weekly RSI divergence.
Bitcoin Dominance
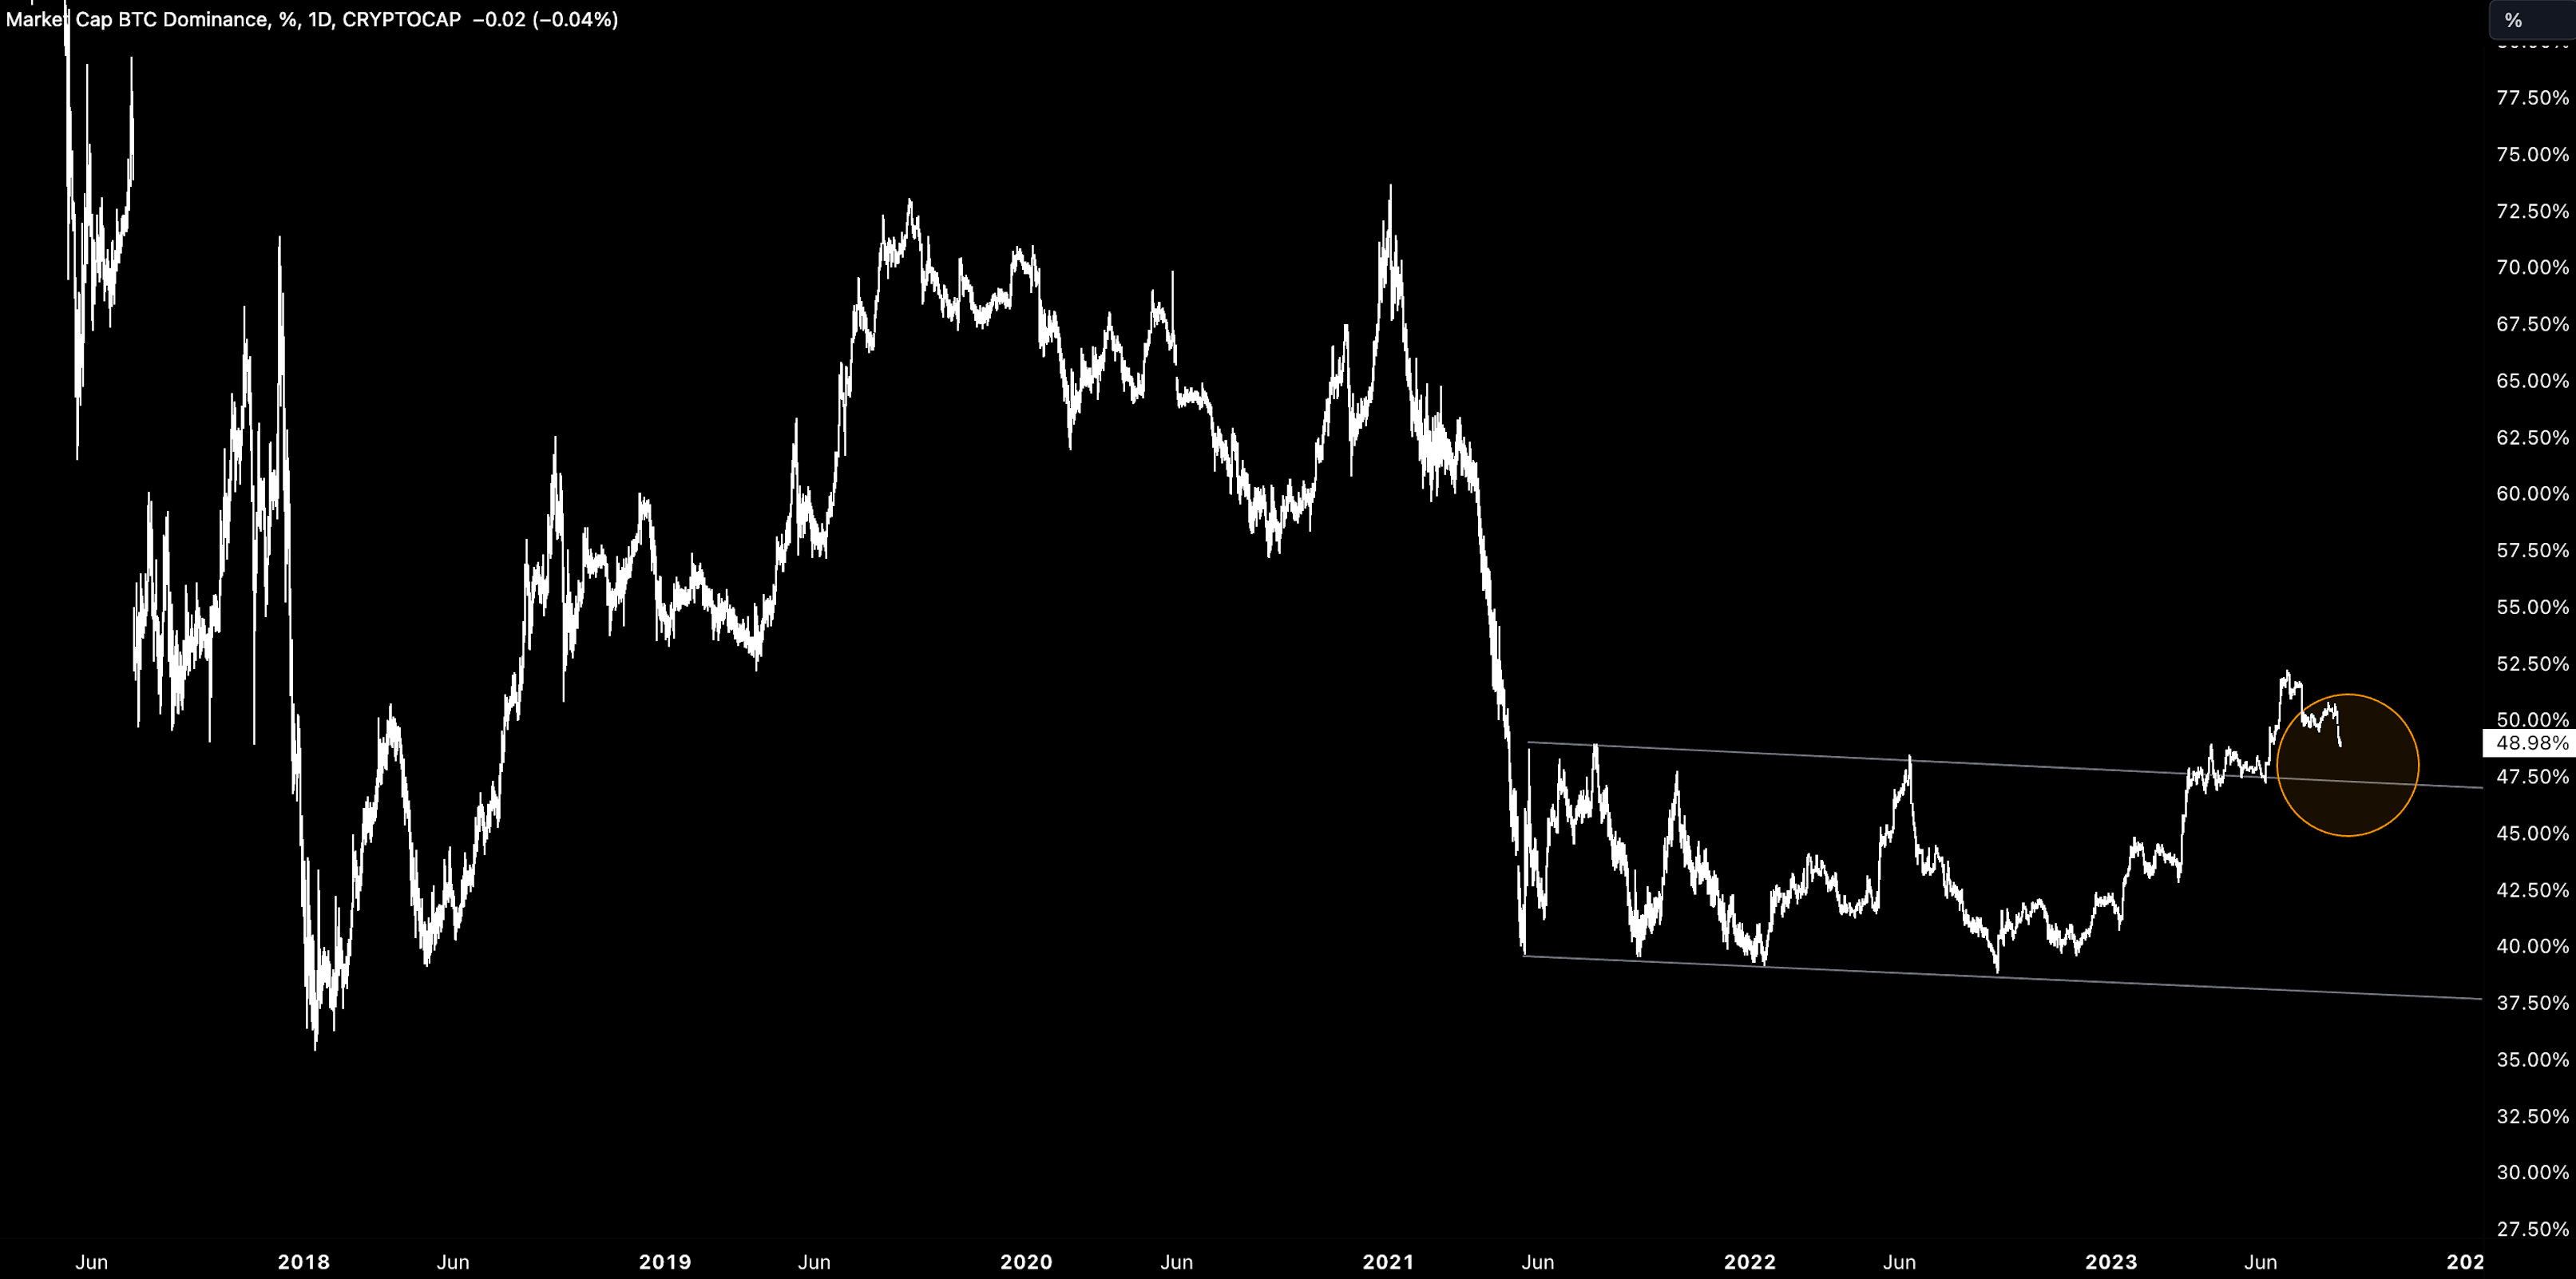
49%; Bitcoin dominance declining in a risk-off period is uncommon but to be expected considering the relative volume of liquidations in the futures market. Expected support between 47-49% over the coming weeks.
DeFi
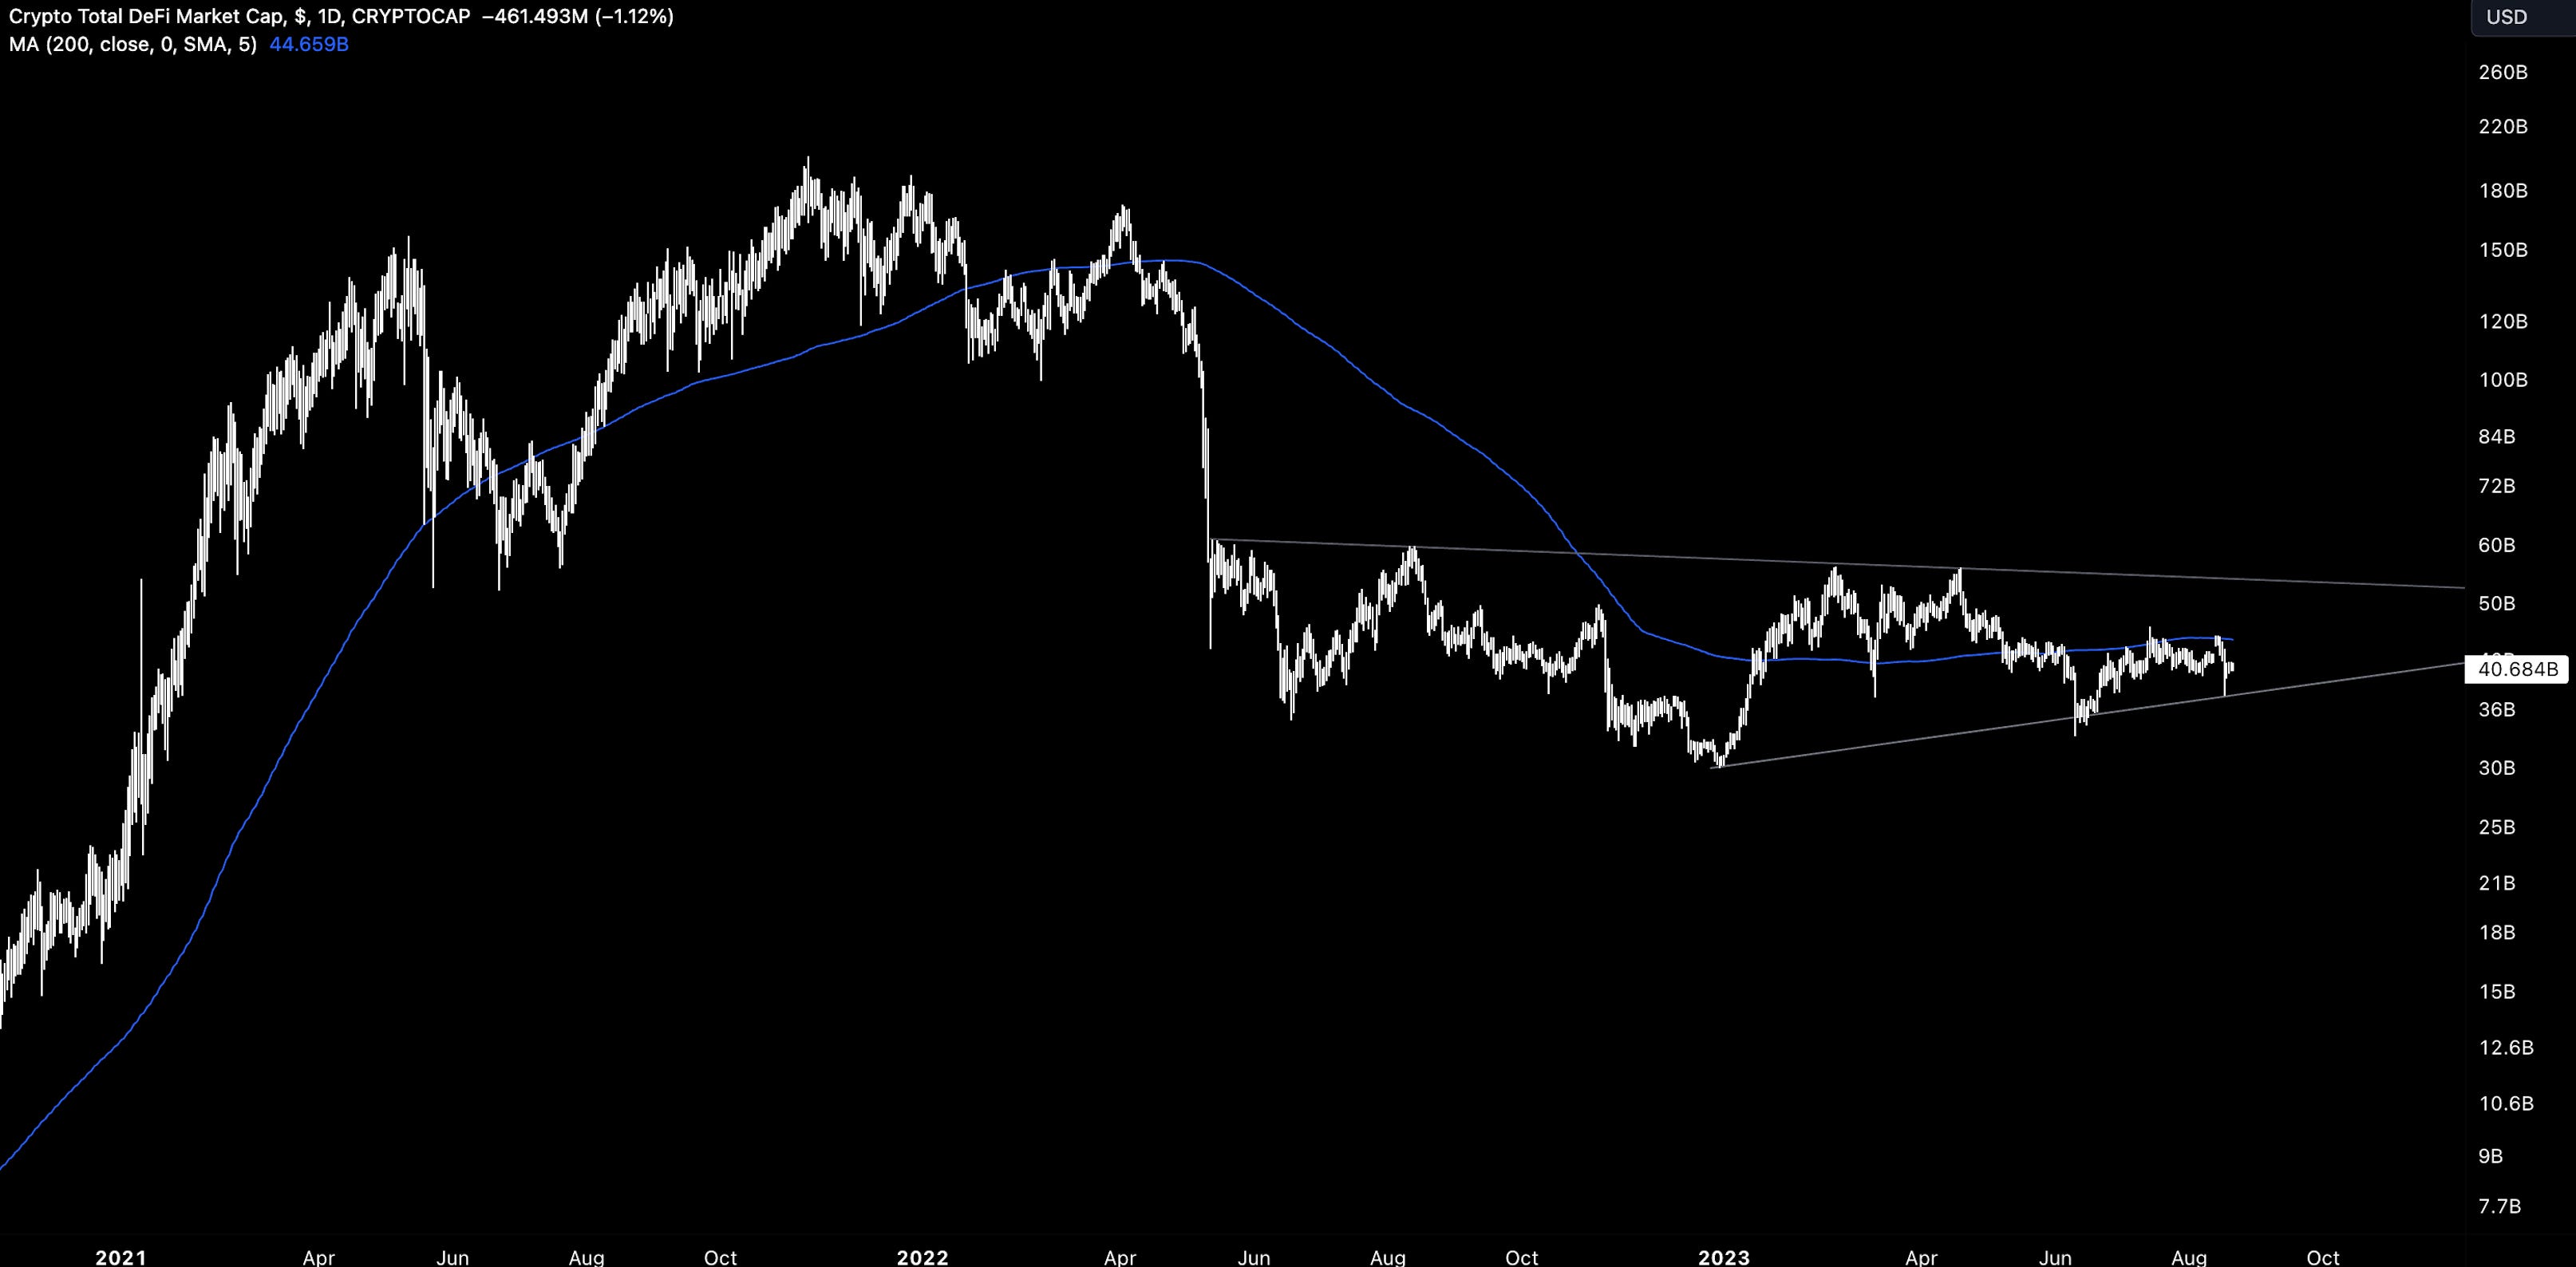
$40B; DeFi MCAP still hovering at the mid-oscillating level of $40B using the 200d MA as resistance as an ongoing test.
Trader Positioning
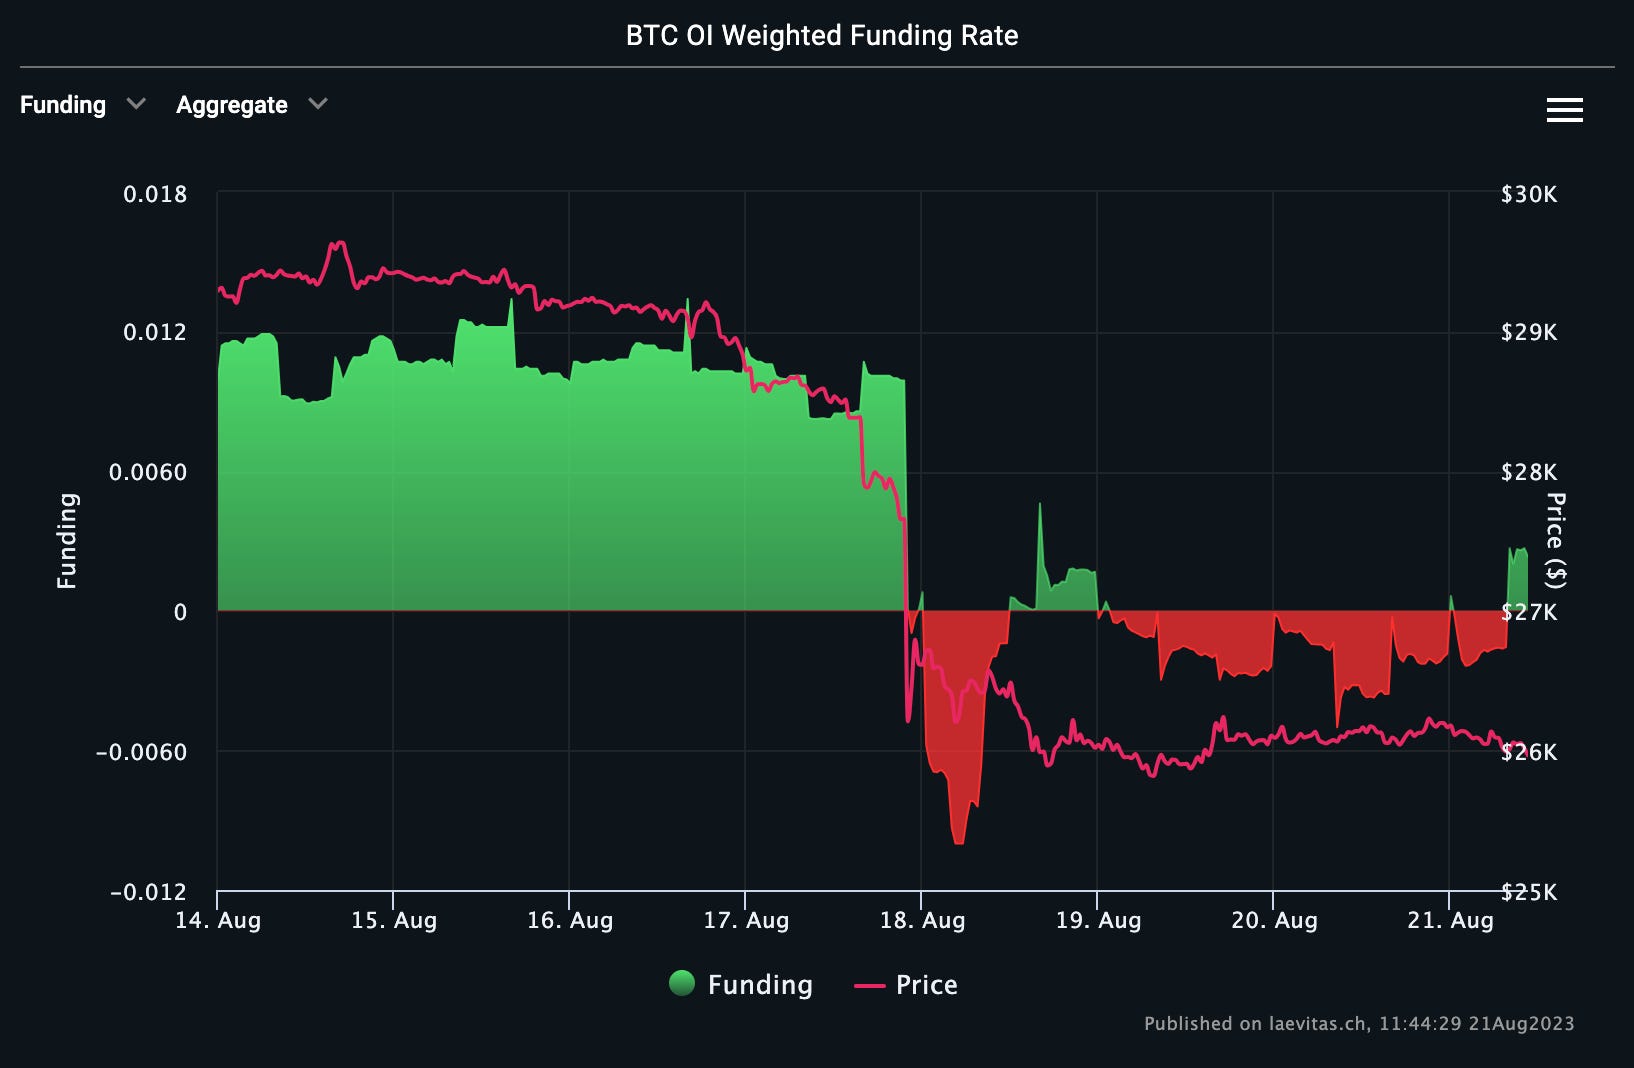
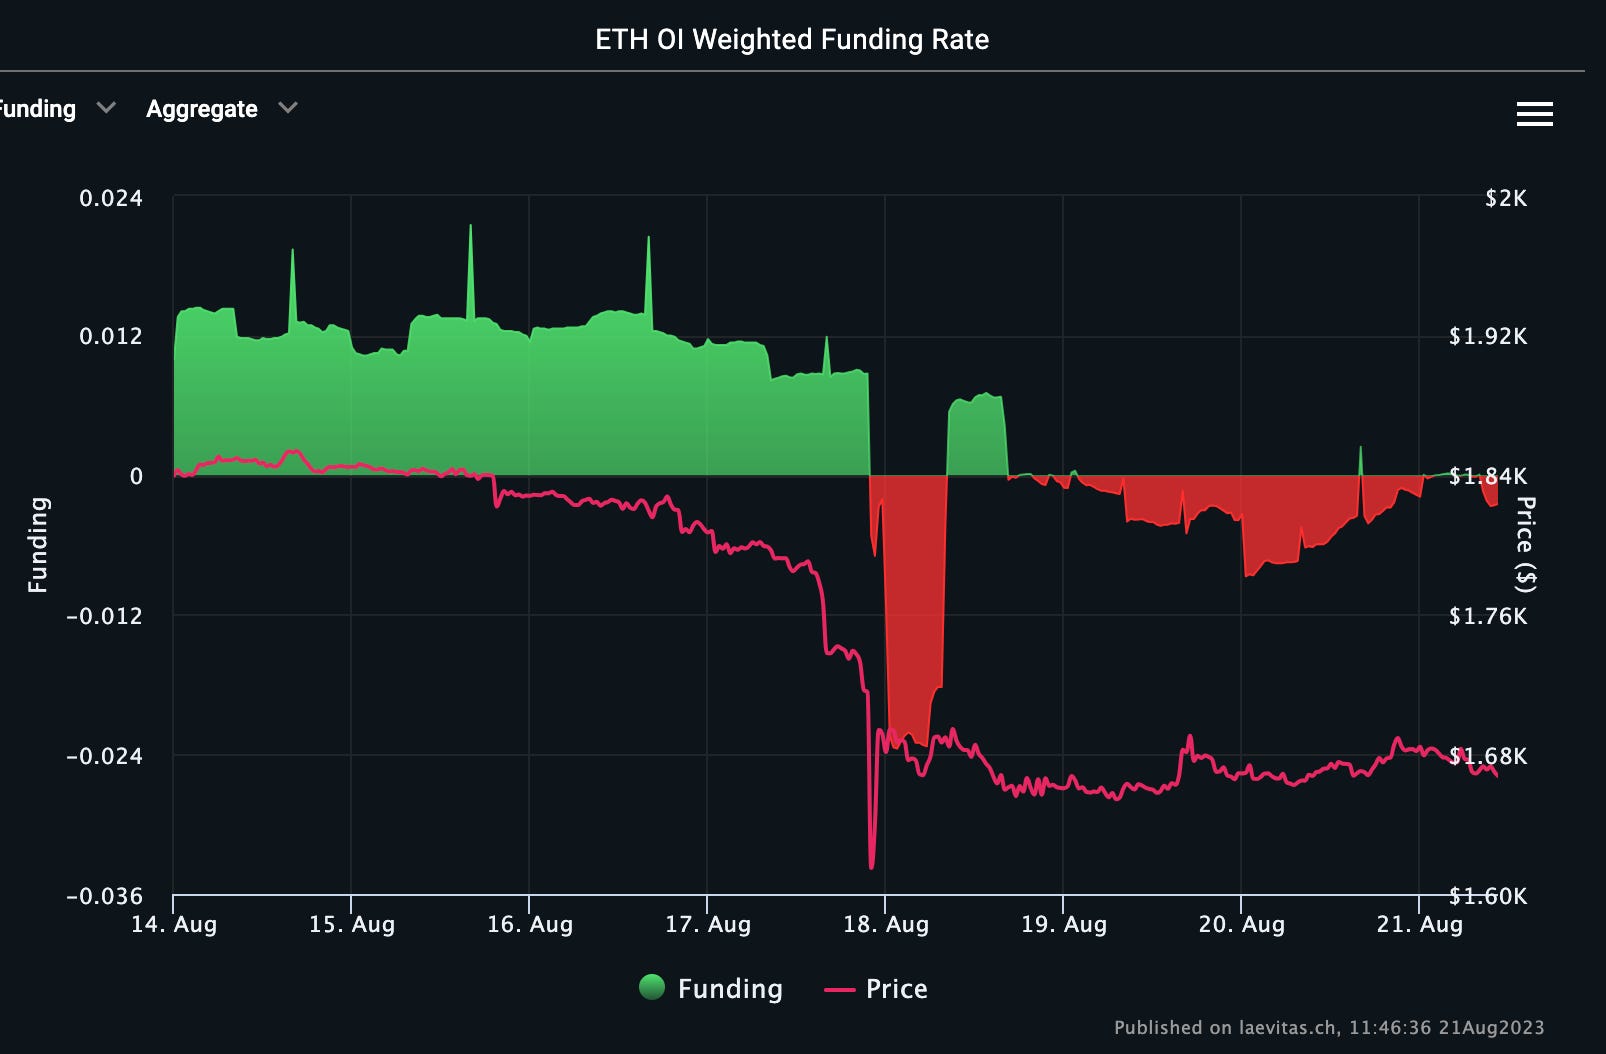
BTC; BTC OI weighted funding rates have flipped positive (0.002) after a full reset in trader positioning occurred last week. Lower positive funding rates relative to pre-price crash indicate traders are more cautious at $26k.
ETH rates are more neutral/negative with traders more muted in their outlook.
Grayscale Trusts
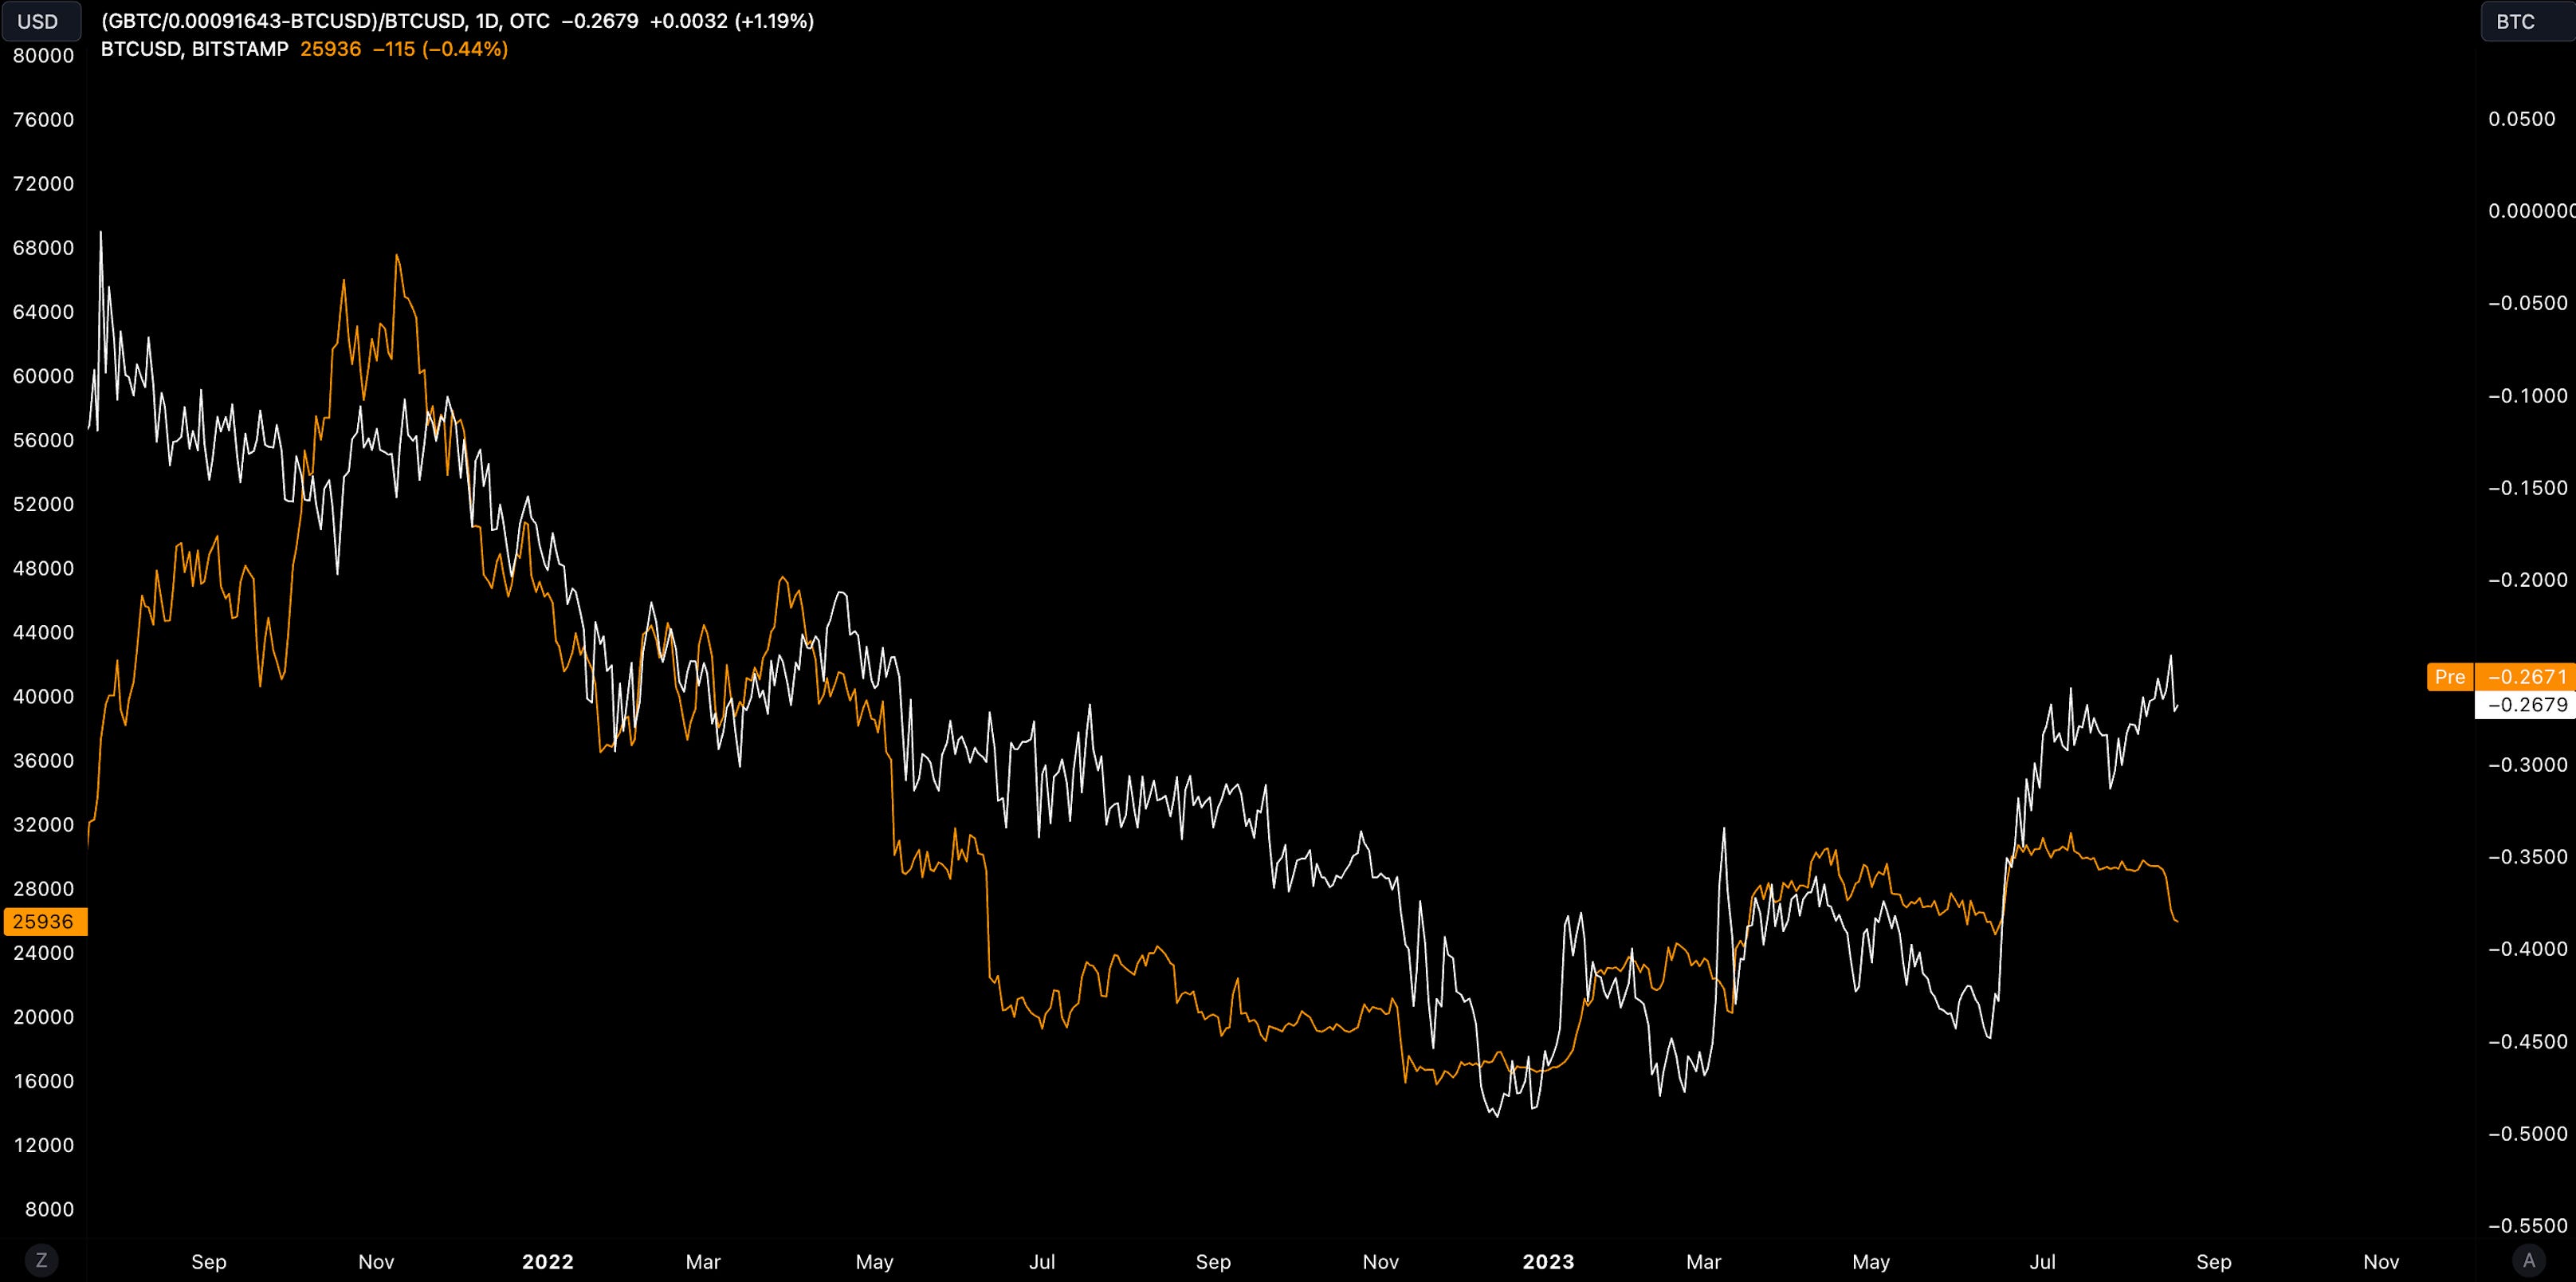
GBTC; GBTC’s discount to NAV declined by 2% but the trend remains discount compression. Traders playing the GBTC in the context of a spot ETF approval remain resilient despite the ETF headlines last week.
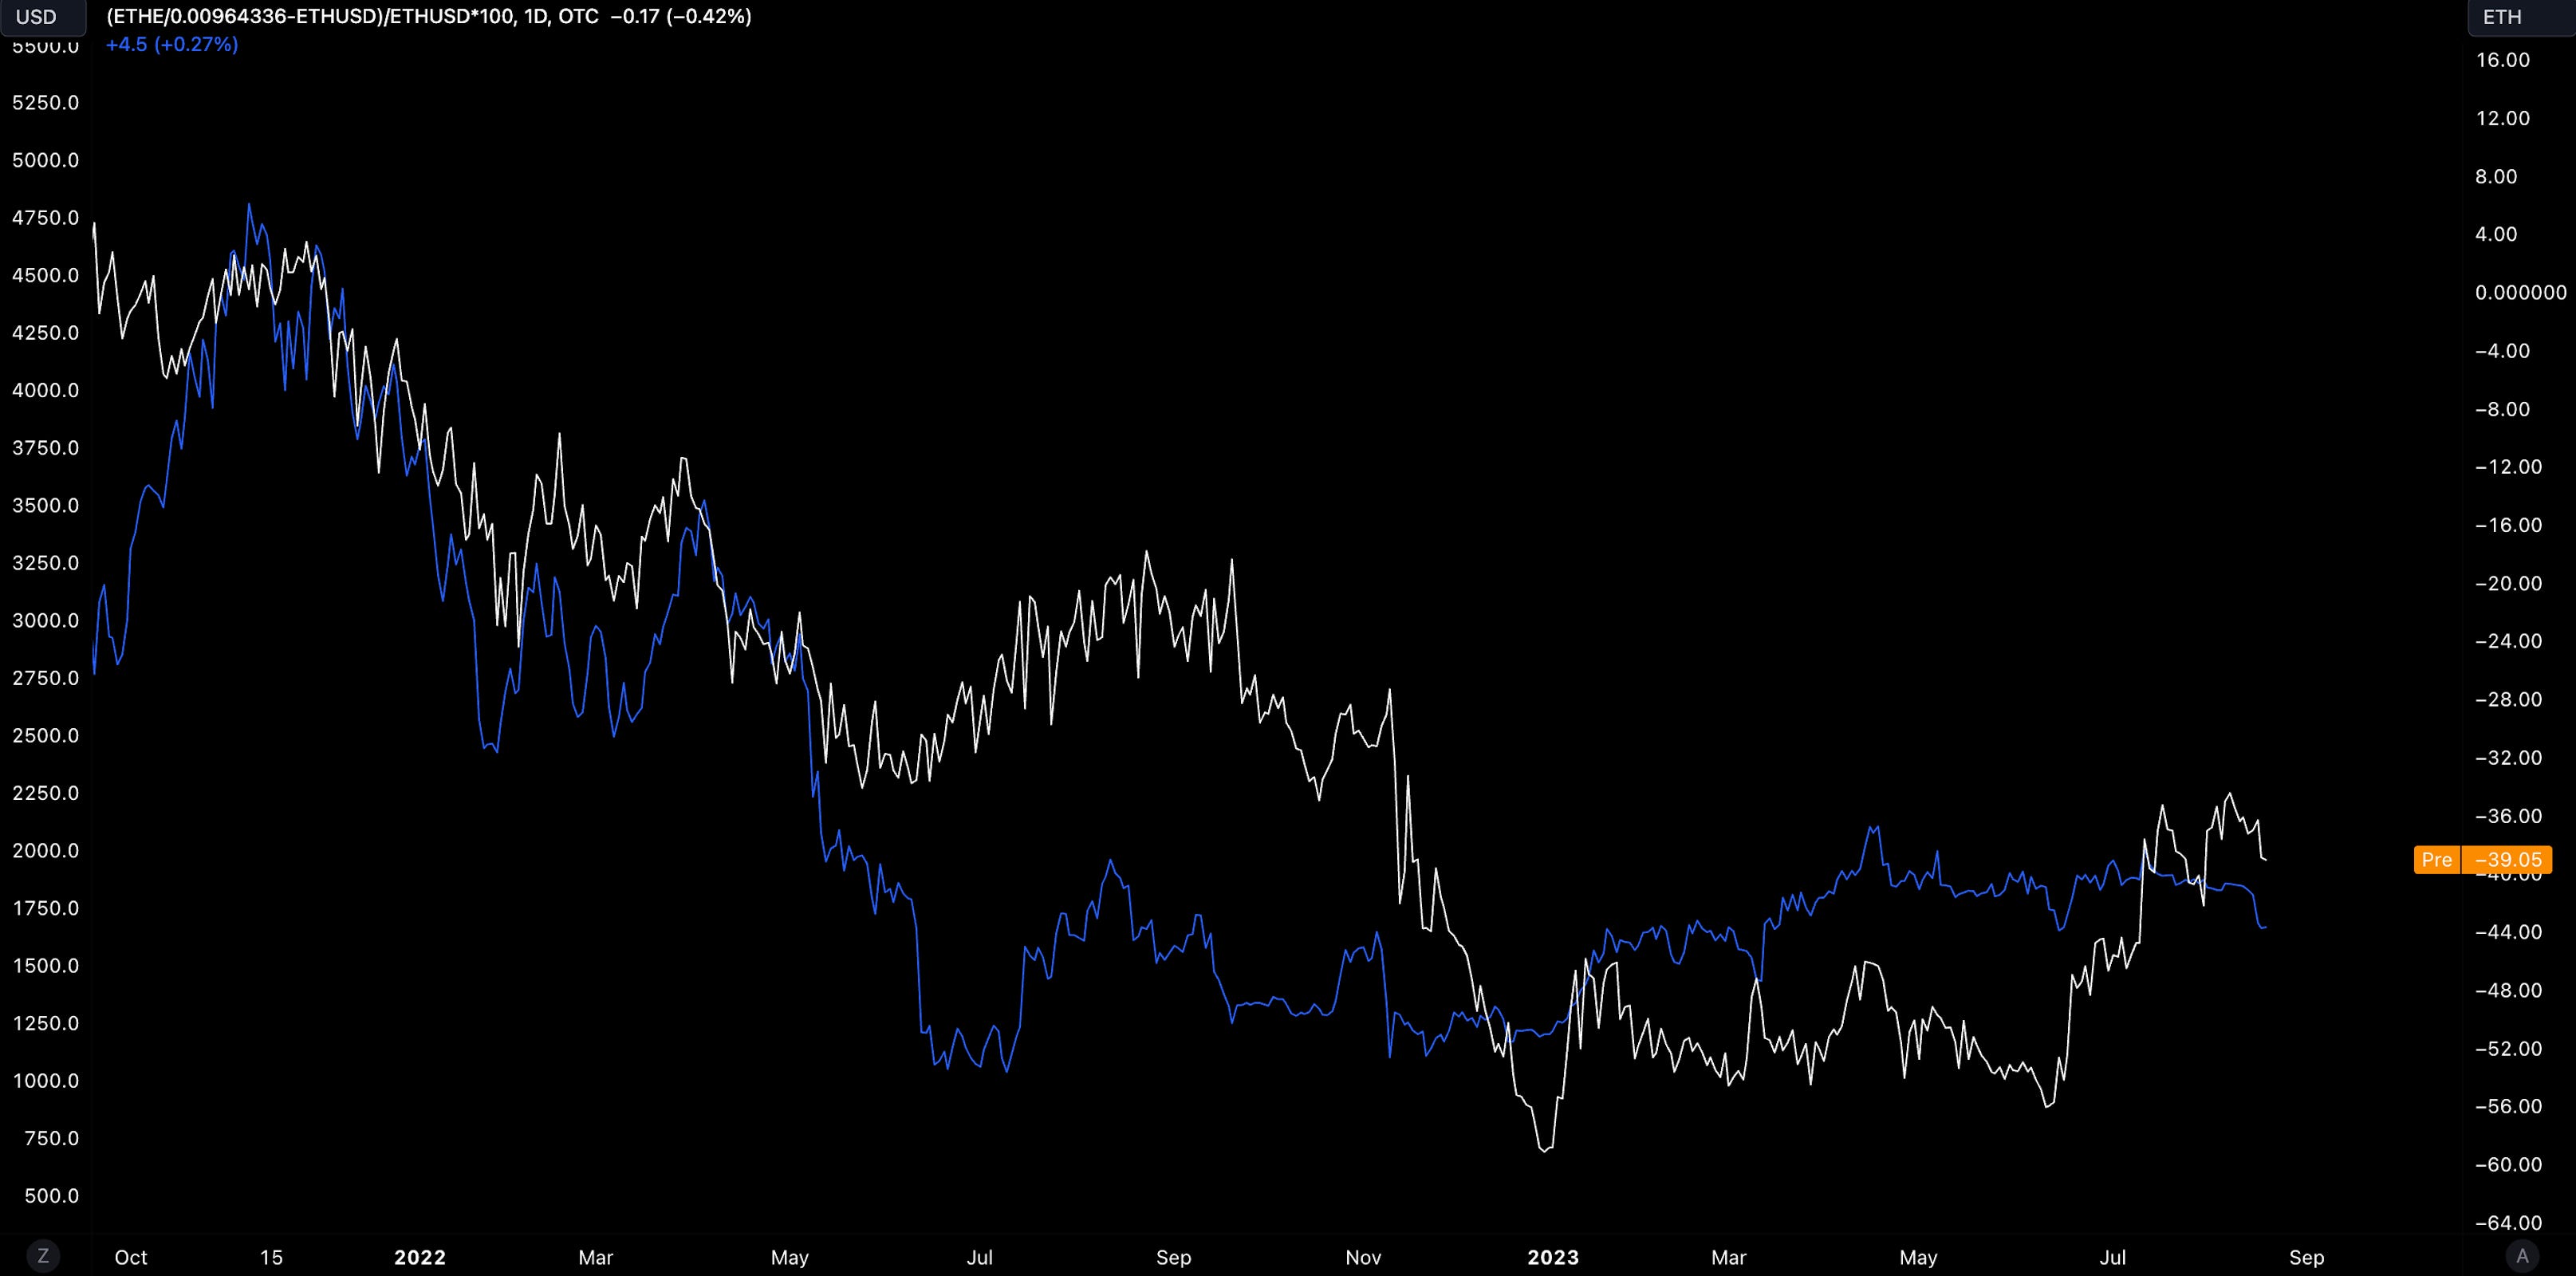
ETHE discount to NAV at ~39% and shows similar dynamics to GBTC (above).
BTC/USD Aggregate Order Books
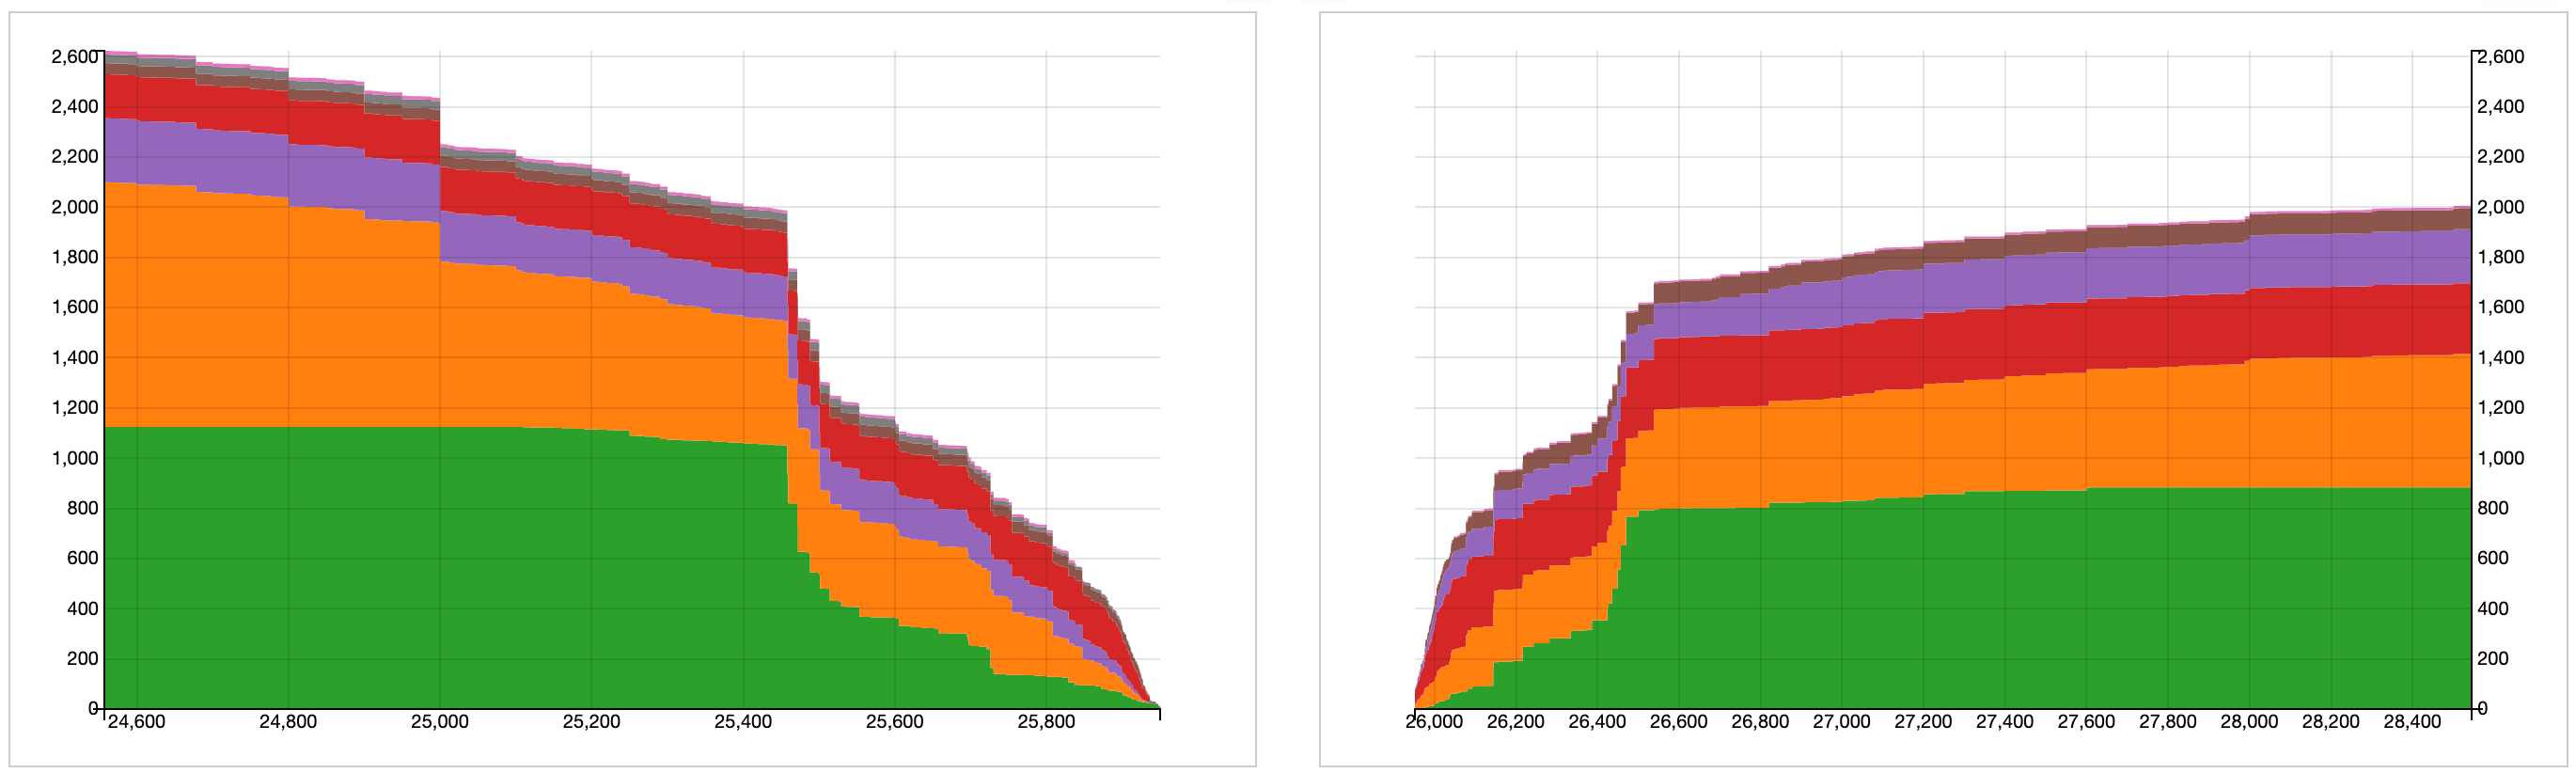
Order books are slightly heavier on the bid side. Heavier resistance up to ~$26.4k.
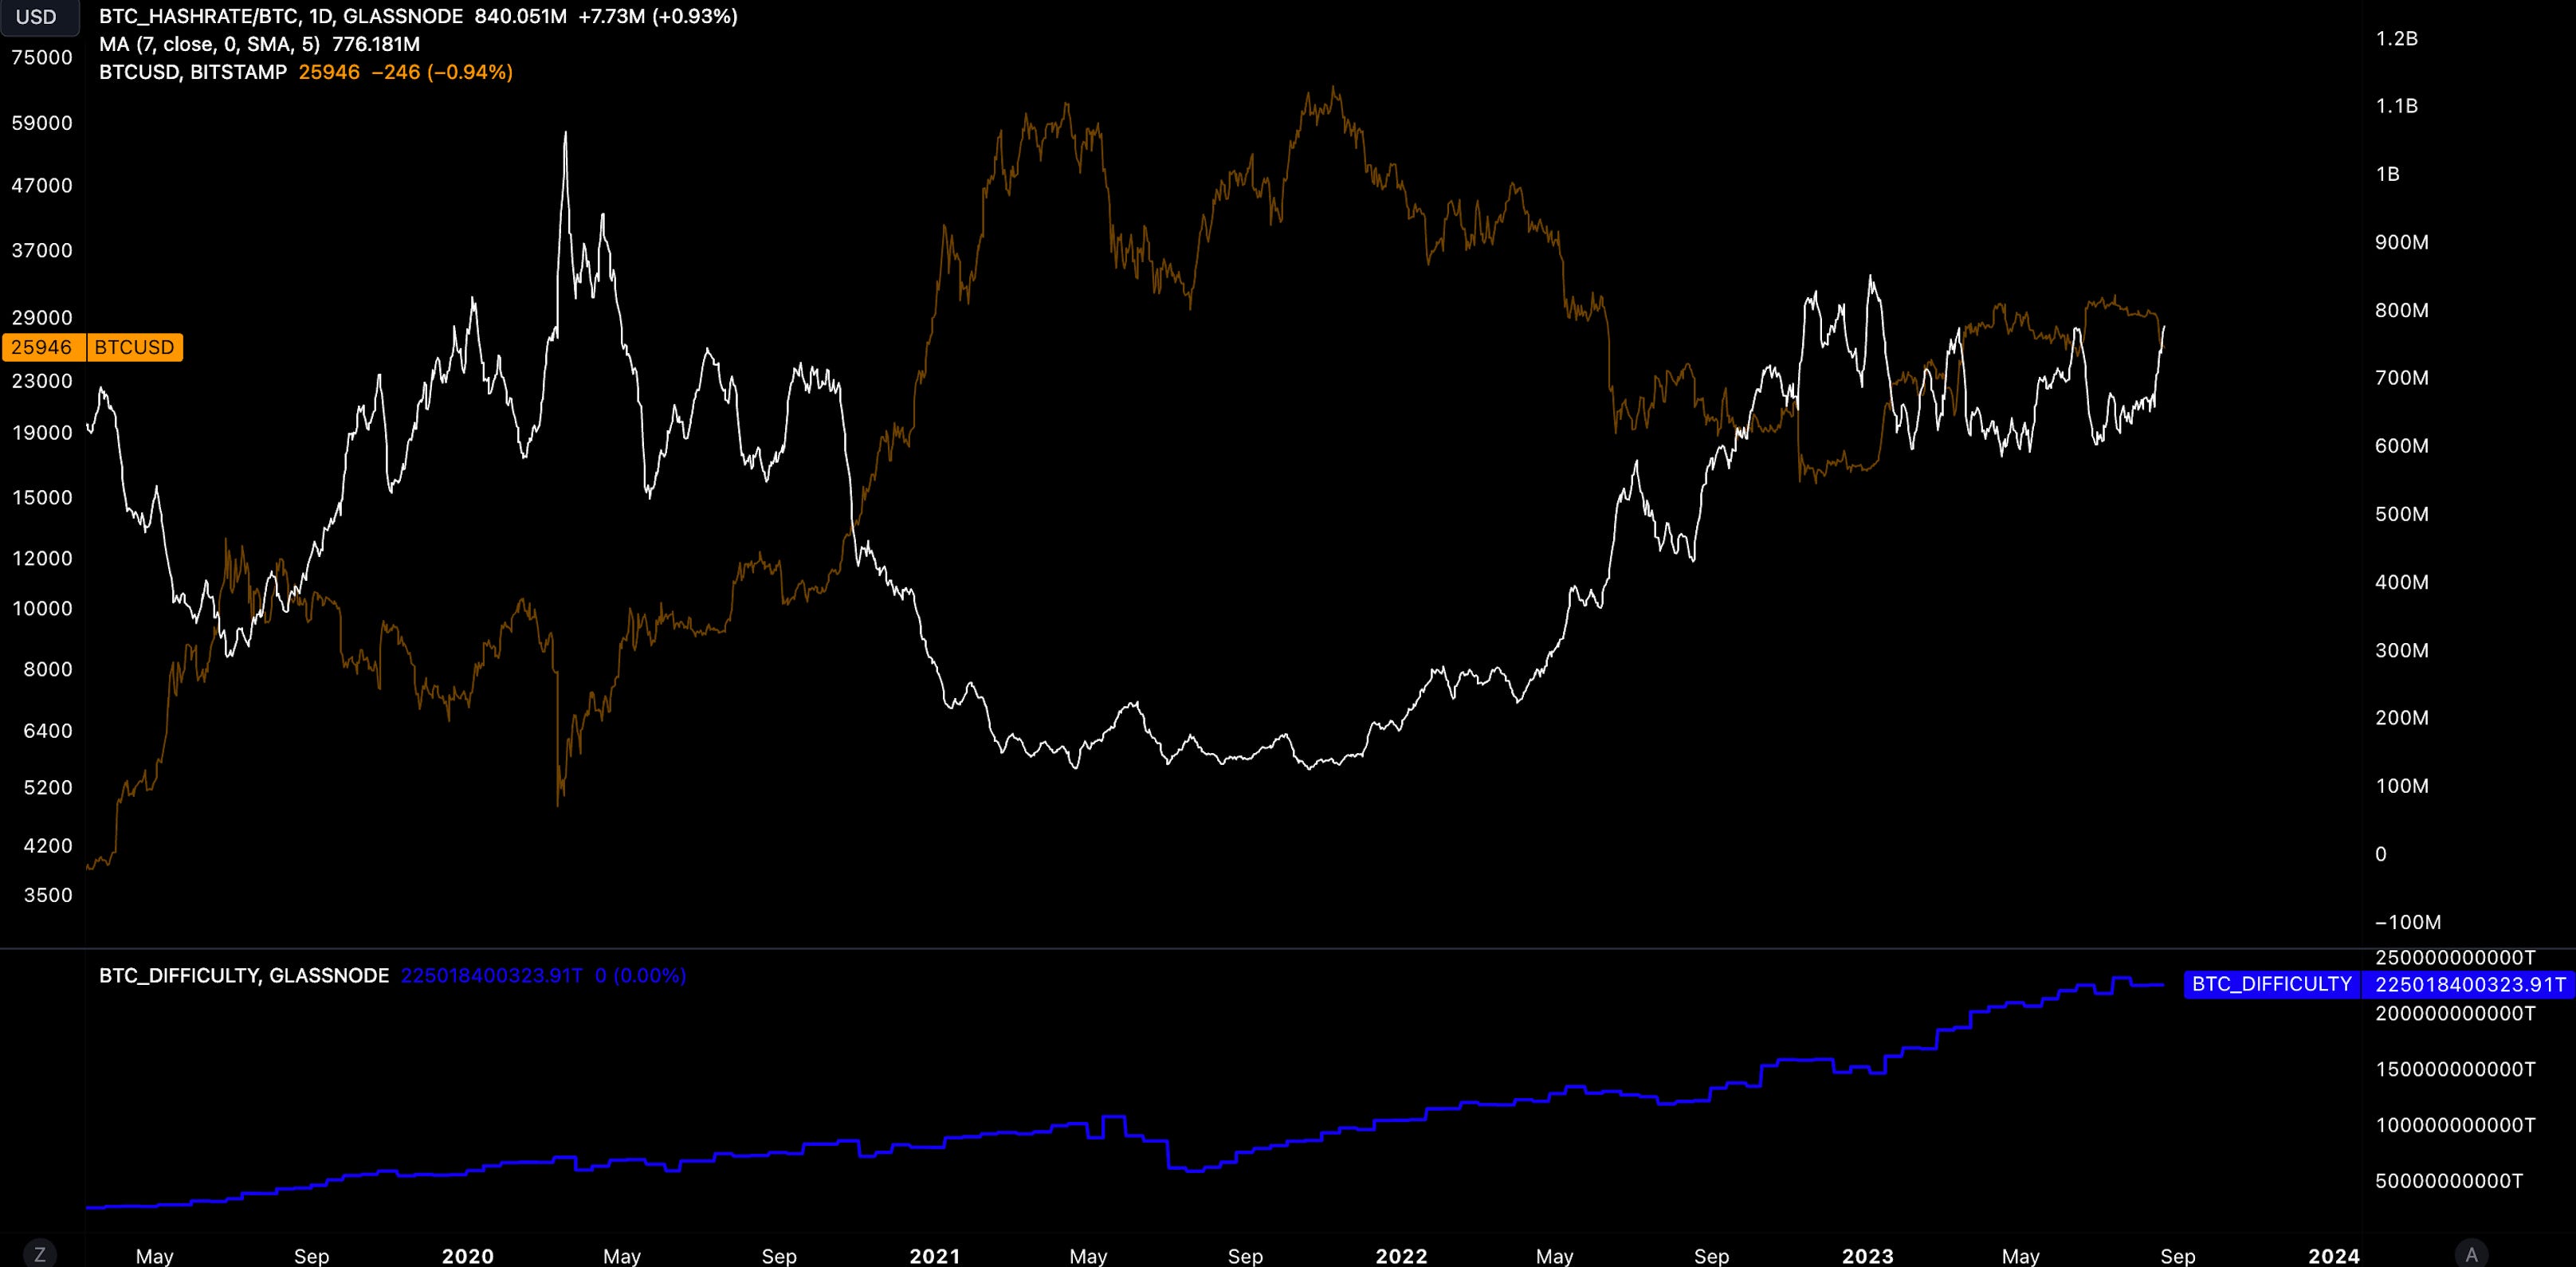
Miners
Bitcoin hash rate still climbing with miner commitment climbing 56% YTD.
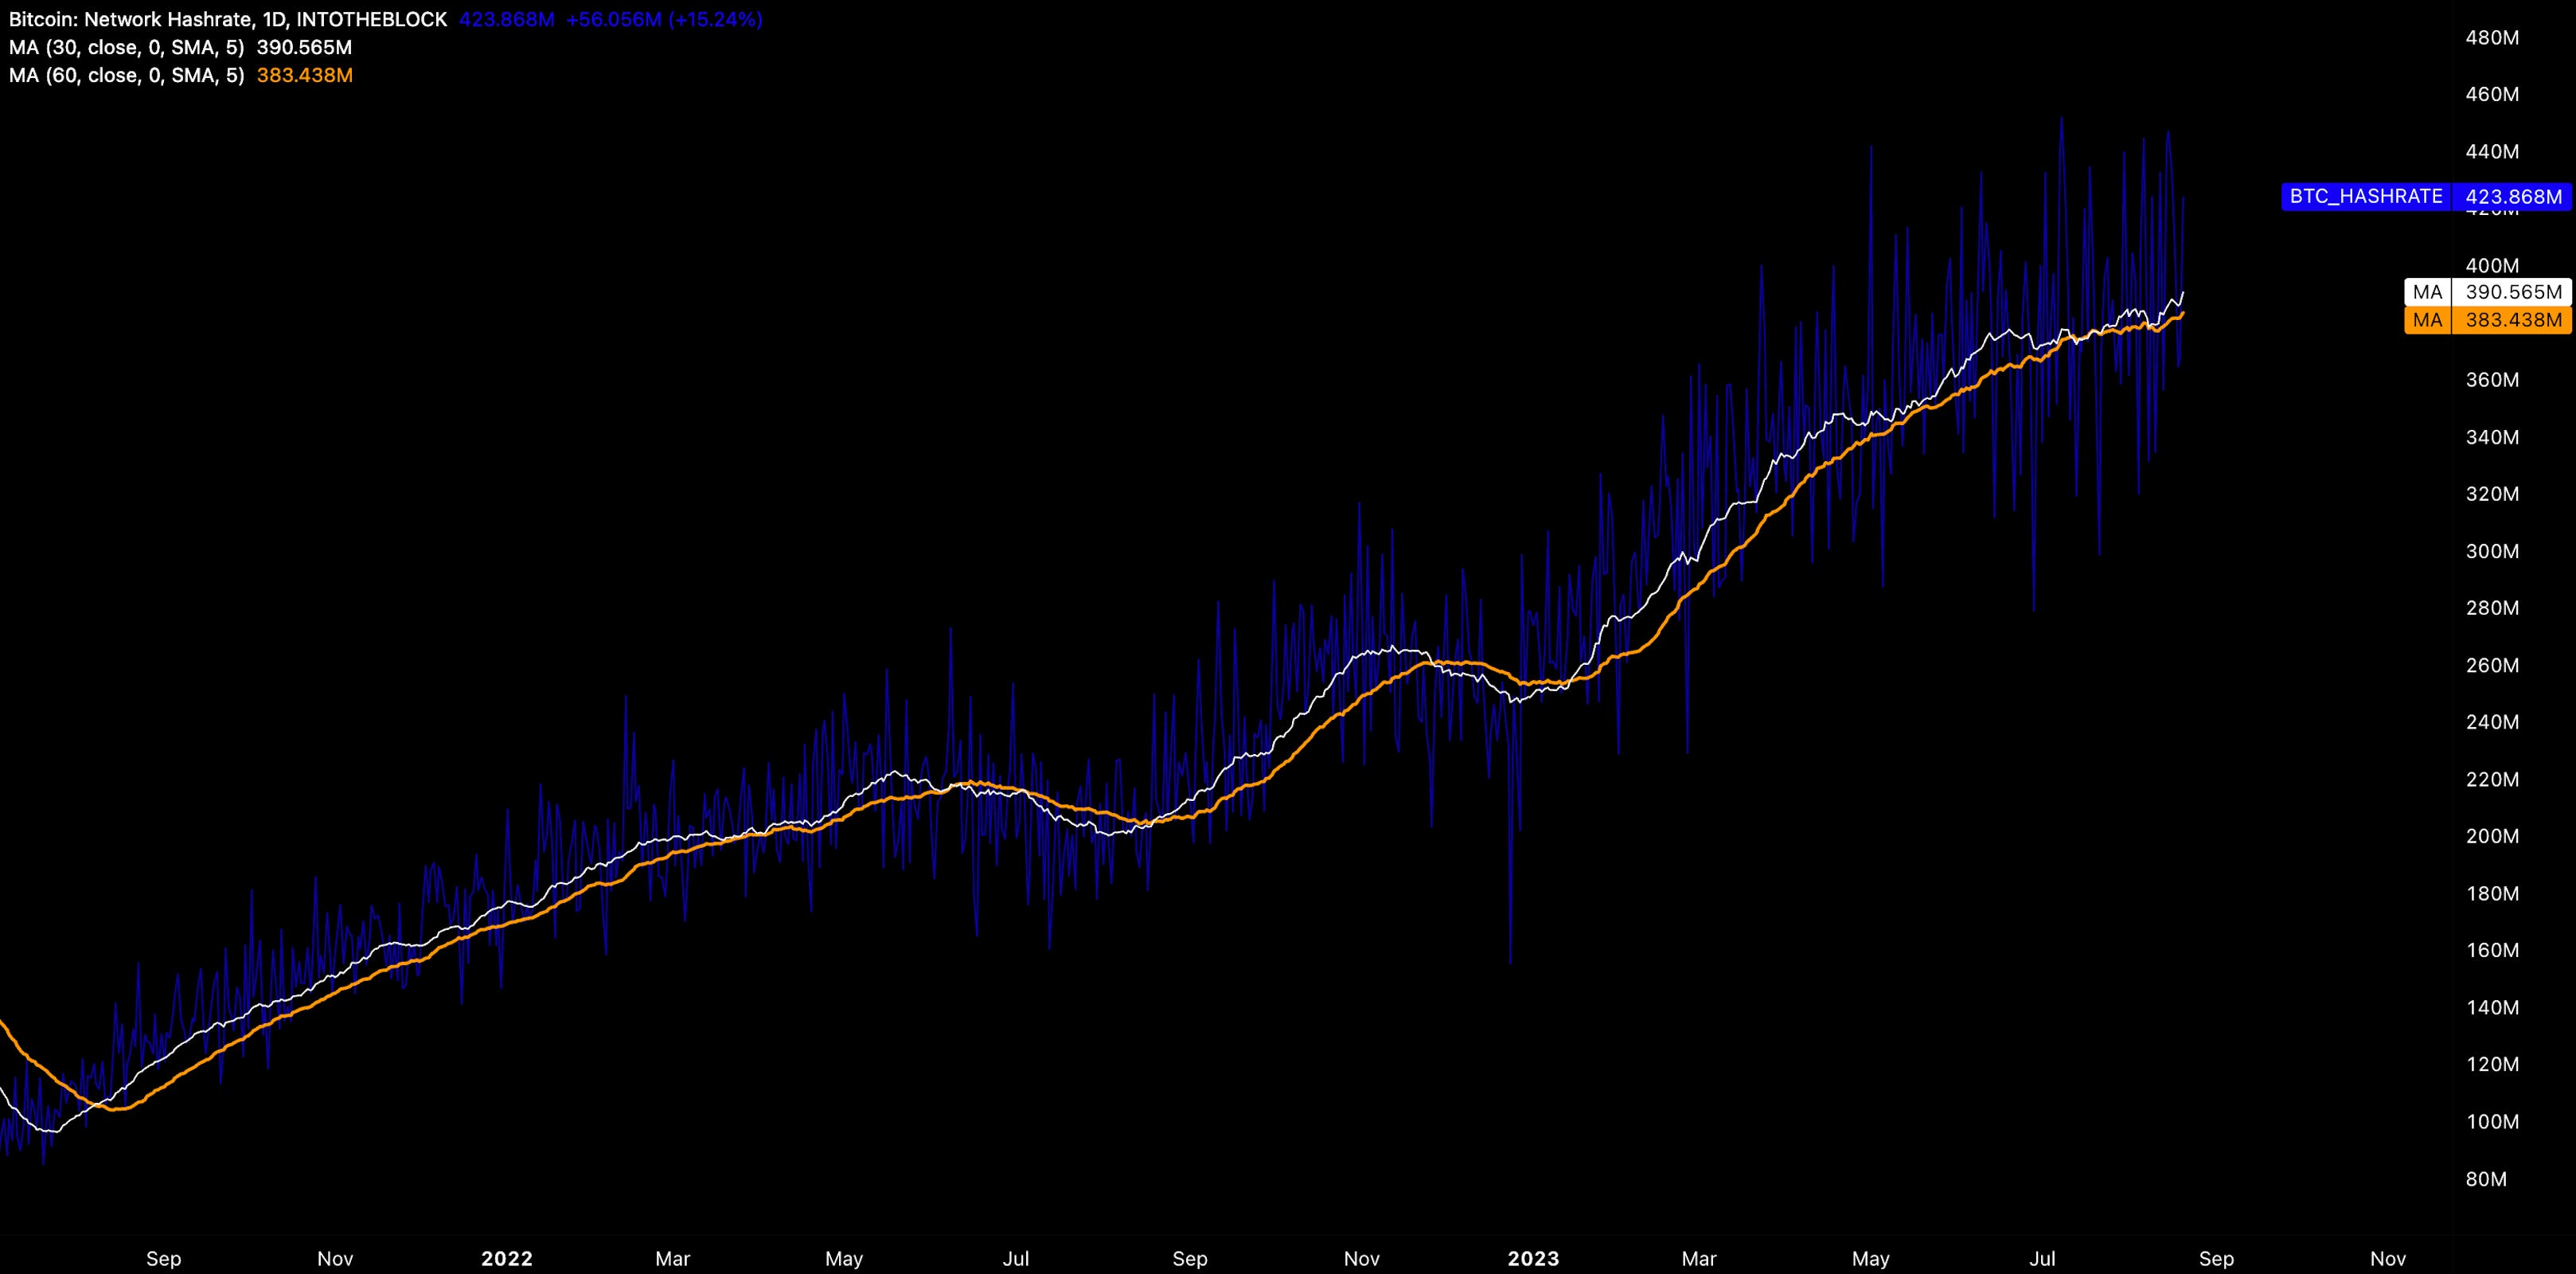
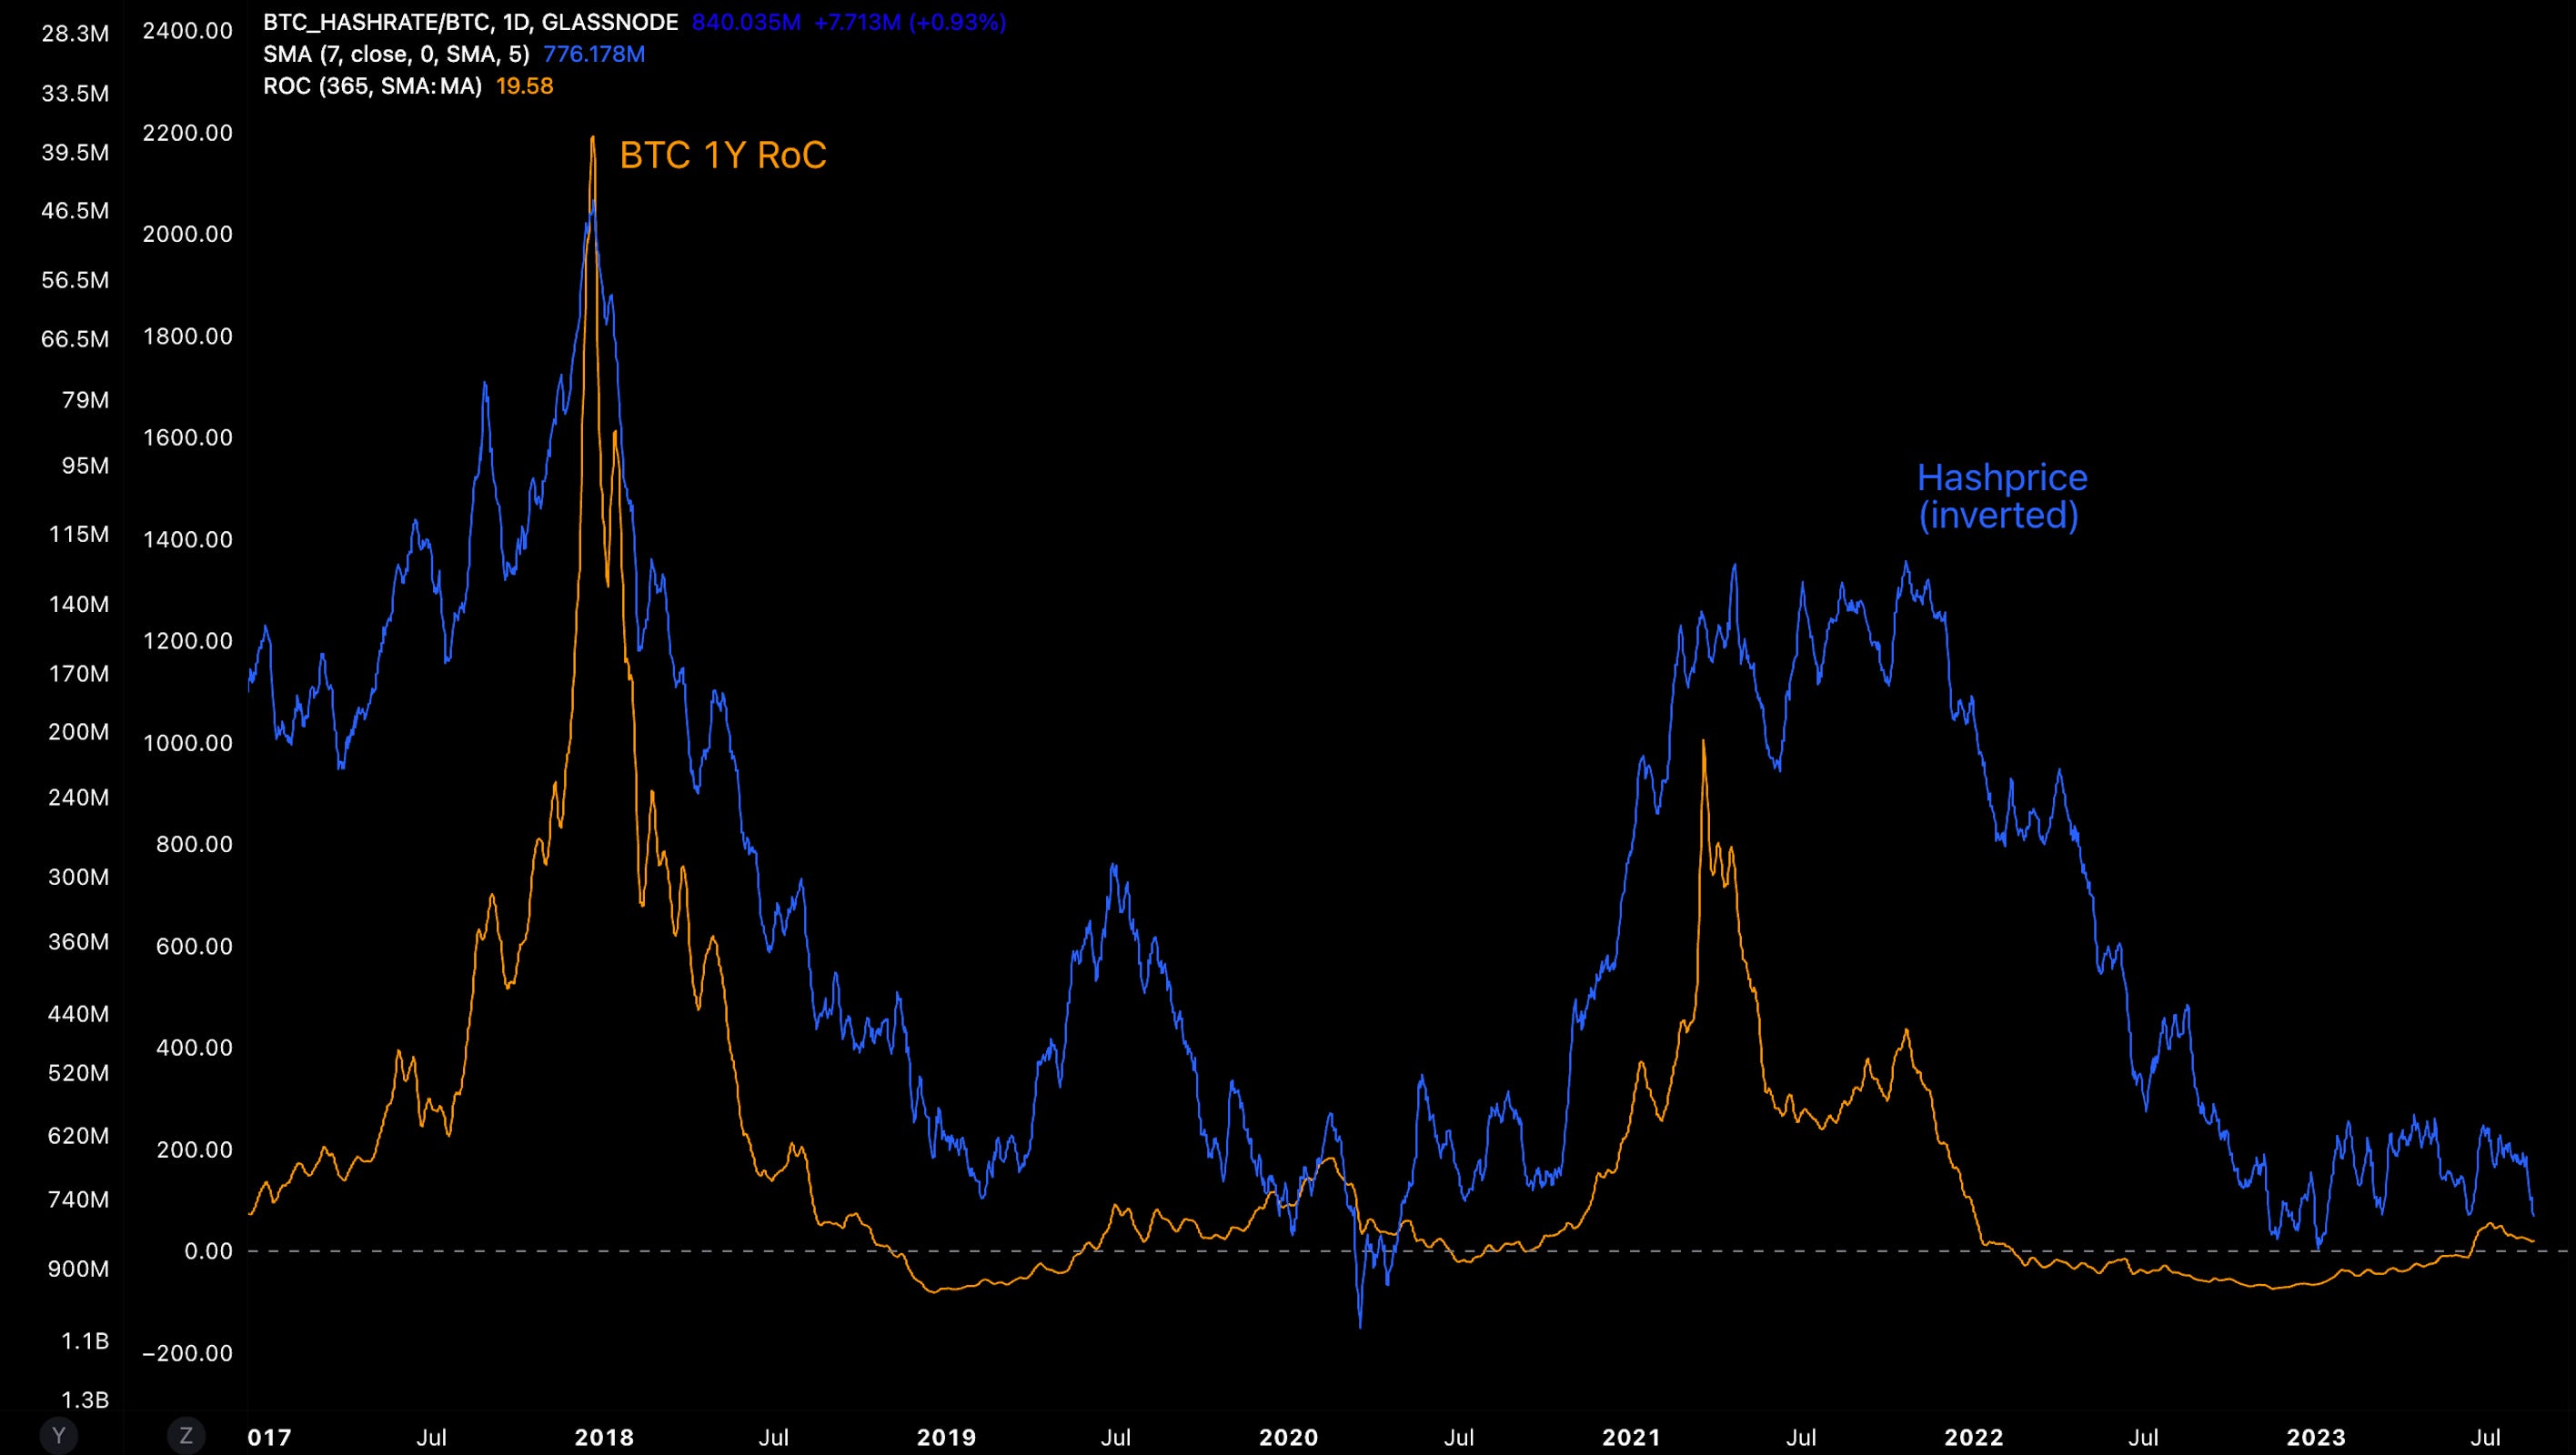
Hashprice surging as miner commitment strengthens with weaker price action. In other words, network security is outpacing market valuations. This exposes Bitcoin miners is drawn out but equally may mean valuations need to ‘catch up’.
After all, a falling hashprice is met with positive RoC for BTC prices historically.

Top performers are a mixture of alt L1s and blue chip DeFi names with bottom performers being predominately alternative L1s:
Top 100 (7d %):
Thorchain (+19.3%)
Quant (-1.8%)
Radix (-2.2%)
Hedera (-2.7%)
Tron (-2.7%)
Bottom Top 100 MCAPs (7d %):
ApeCoin (-26.6%)
Pepe (-24.5%)
Shiba (-23.3%)
Uniswap (-22.4%)
Render (-20.6%)

> Why Facebook’s Stablecoin Failed with David Marcus [Bankless]
> On Risk Management and Credit Markets [On The Brink]
> Tornado Cash Sanctions Upheld In Court [The Break Down]
> Why Adidas is All In On Web3 [RV]
> Superscrypt: Asia’s Powerhouse Web3 Venture Fund [Block Crunch]

> SEC says recent Ripple ruling could have ‘substantial impact’ on other court cases [Blockworks]
> Regulatory landscape across Asia prompts exchanges to enhance KYC measures [Blockworks]
> Atoms, Institutions, Blockchains [Josh Stark]
> Software Patents [Dan Robinson]
> Crypto Miners Are Attempting to Diversify Into Other Business Areas: JPMorgan [Coindesk]
Key RxR Links:
> Republic Crypto
> Re7 Capital
> Republic Group
About RxR
RxR is a fund partnership between Republic Crypto and Re7 Capital that leverages Republic Crypto’s leading Web3 advisory, venture capital, enterprise-grade infrastructure and treasury management capabilities, with Re7 Capital’s DeFi expertise and technology.
About Republic Crypto
Republic Crypto is a leading Web3 advisory with full-stack solutions for launching digital assets through consulting, token design and minting, and issuance solutions.
About Re7 Capital
Re7 Capital is a DeFi firm specializing in blockchain yield-seeking strategies. Its analytics engine gathers real-time data from 200+ protocols across stablecoin and ETH liquidity pools.
Disclaimer
RxR, Republic Crypto, and Re7 Capital may have investments in assets or protocols identified in this report. The information above does not constitute an offer to sell digital assets or a solicitation of an offer to buy digital assets. The contents of each of these reports reflect the opinions of the respective authors of the given report and are presented for informational purposes only. Nothing within this or any published reports is, and should not be construed to be, investment advice.